The Road Ahead
By Colin Twiggs
October 18, 3:00 a.m. ET (6:00 p.m. AET)
These extracts from my trading diary are for educational purposes and should not be interpreted as investment or trading advice. Full terms and conditions can be found at Terms of Use.
Global leaders face a tough choice in the year ahead. Do they continue on the same road as before and attempt further monetary stimulation and credit expansion to soften the landing? Or do they allow the market to find its own equilibrium interest rate and allow the necessary fall in prices (economists refer to this as deflation) in order to restore market stability? The first option may soften the landing; but will also raise inflation, prevent the restoration of market stability, and condemn us to a lengthy period of stagflation (low growth accompanied by high inflation) that could last for decades. Allowing the market to find its own equilibrium, on the other hand, would be accompanied by a short, sharp period of readjustment, with falling prices and more bank bailouts — but would be over within two to three years.
The second option is more desirable in my eyes, because it would herald the return to responsible fiscal policy — and a relatively stable business cycle, without the exaggerated boom-bust of recent years. It does not garner votes, however, and is therefore unlikely to be attempted. Expect a lengthy period of stagflation — if we succeed in avoiding a depression, that is.
This outlook is critically important to long-term investors who adopt a buy and hold strategy in the stock market, whether private investors or fund managers managing your retirement account. They are likely to suffer an extended period of low or zero growth. Traders, on the other hand, will profit from the increased volatility.
Banking Spreads
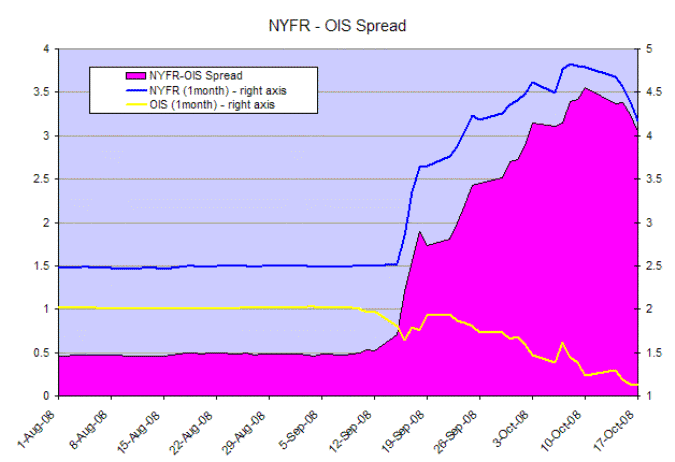
Inter-bank lending remains constricted, choking the flow of credit to the economy. The NYFR-OIS 1-month spread cannot continue at current levels without causing further instability. The spread between the New York Funds Rate (NYFR) and the overnight index swap rate (OIS) reflects confidence levels in the interbank market.
Gold & Crude Oil
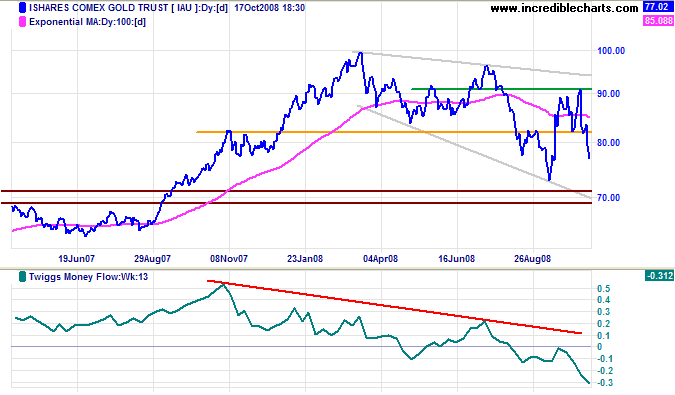
Spot gold broke through medium-term support at $820 per ounce (the IAU chart below reflects prices for 1/10th of an ounce). Failure to test the upper border of the descending broadening wedge warns of a downward breakout. This is reinforced by Twiggs Money Flow (13-week) signaling strong selling pressure. The target for breakout below $700 is the June 2006 low of $550.
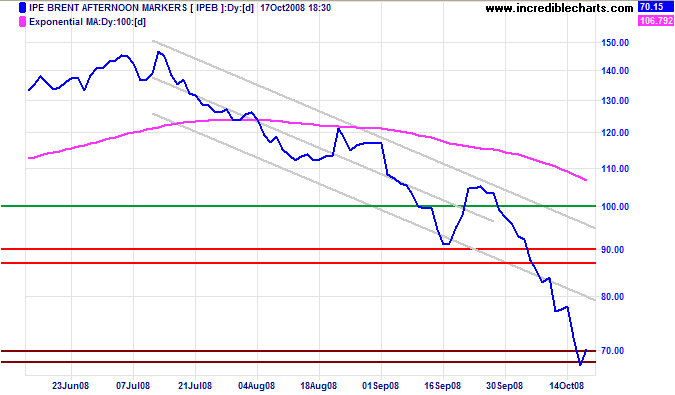
Crude oil is testing the band of support at $70 per barrel. Expect a short retracement, but the level is unlikely to hold as the global economy heads towards recession. Failure would test the 2007 low of $50/barrel.
USA
Dow Jones Industrial Average
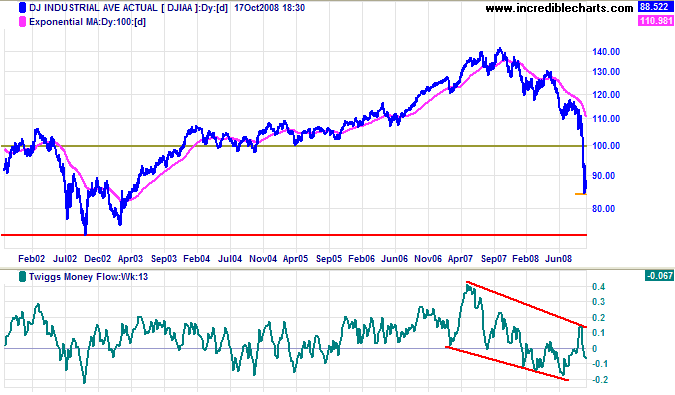
The Dow displays a short-term pennant, signaling continuation of the down-trend. Massive volatility is reflected by the wide range: 8000 to 10000. Downward breakout would test the 2002 low of 7300.
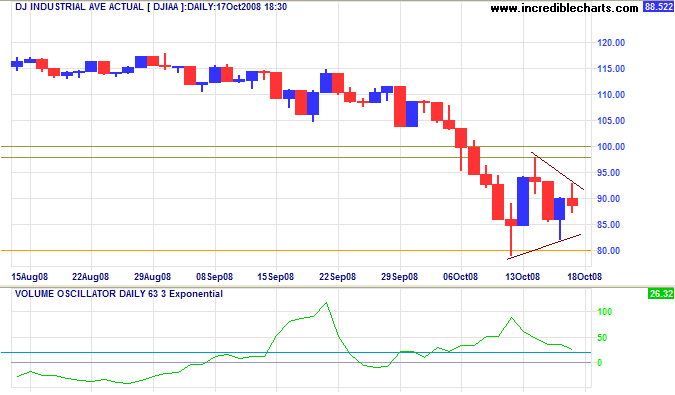
Long Term: The band of support between 7000 and 7300 represents the 50 percent retracement level for Fibonacci followers. Twiggs Money Flow (13-week) is tracking downwards. Be wary of a bullish TMF divergence if it accompanies a V-bottom on the price chart.
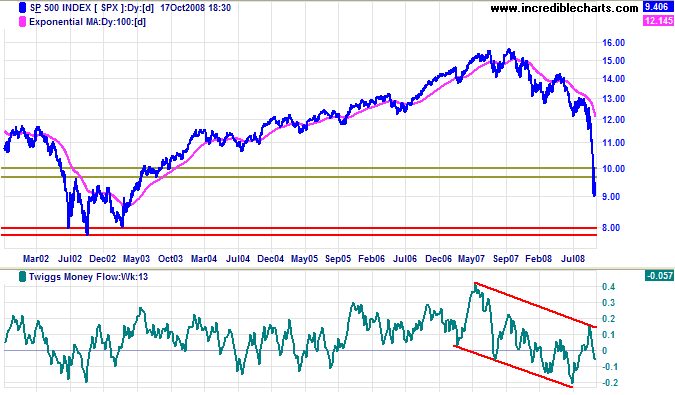
S&P 500
The S&P 500 shows a similar short-term consolidation to the Dow. And is likely to again test support at 800: the 50 percent retracement level.
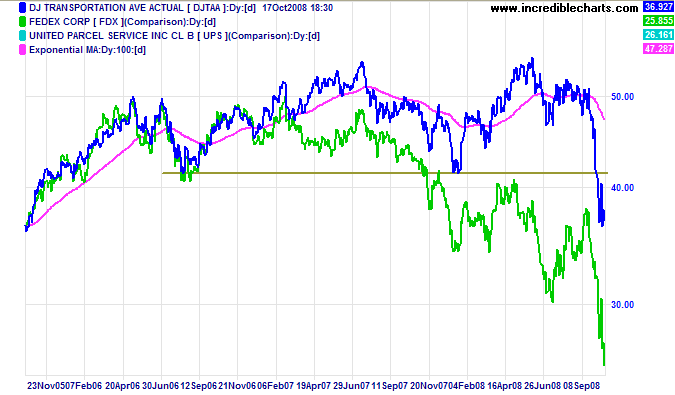
Transport
Fedex and the Transport Average warn that the economy is in free-fall.
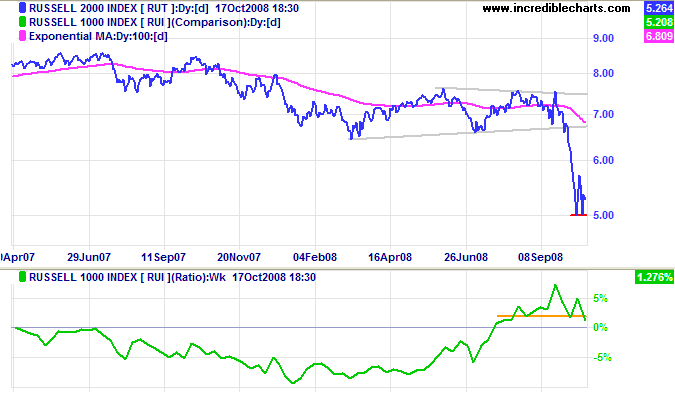
Small Caps
The Russell 2000 Small Caps index is testing support at 500. Expect a continuation of the down-trend. The ratio to the large cap Russell 1000 is now falling, reflecting the flight to safety of large cap stocks.
Technology
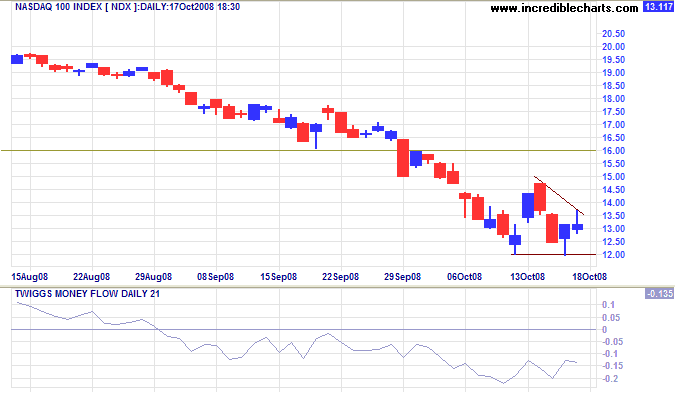
The Nasdaq 100 formed a small consolidation above short-term support at 1200, signaling continuation of the down-trend. Breakout would offer a target of the 2002 low of 800. Twiggs Money Flow (13-week) oscillating below zero signals strong selling pressure.
Canada: TSX
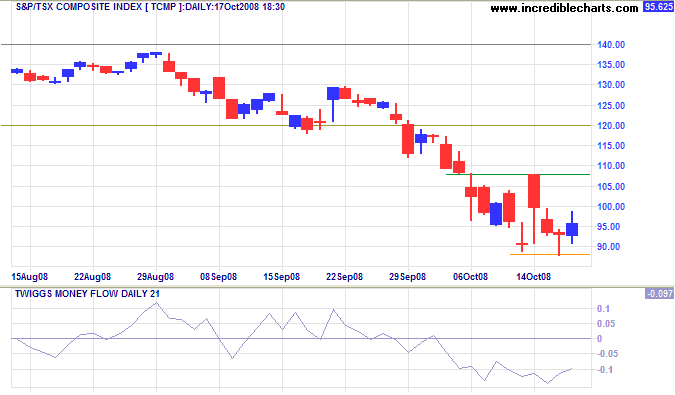
The TSX Composite displays a similar bearish short-term consolidation, with Twiggs Money Flow (21-day) reflecting strong selling pressure. Breakout below support at 9000 would test the August 2004 low of 8000.
United Kingdom: FTSE
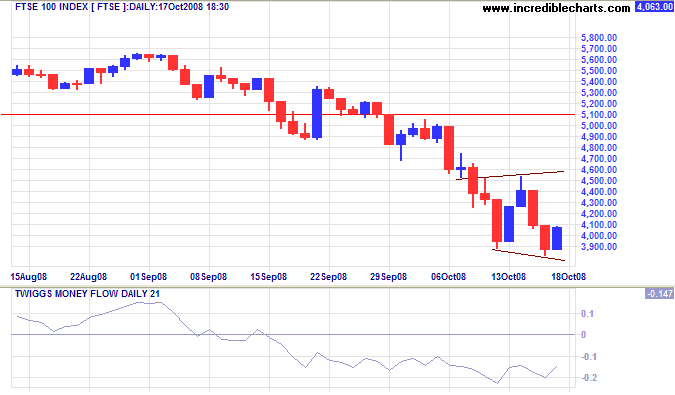
The FTSE 100 shows a broadening short-term consolidation, but the signal is the same: continuation of the down-trend. Downward breakout is likely to test the 2003 low of 3300 (and 50 percent retracement level). Twiggs Money Flow (21-day) holding below zero signals strong selling pressure.
Europe: DAX
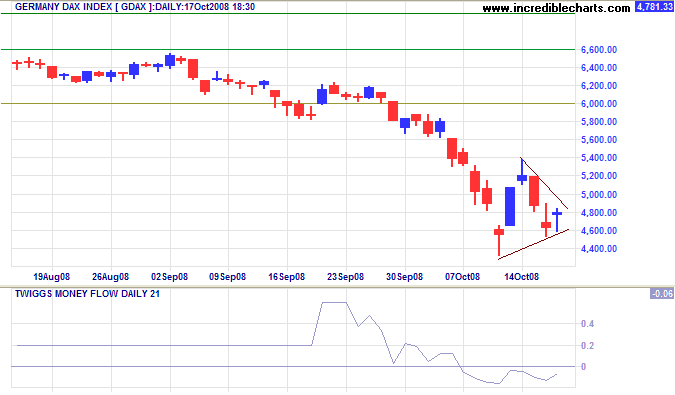
The DAX formed a similar pennant, signaling continuation of the down-trend. Downward breakout would offer a target of the August 2004 low of 3600 — just below the 50 percent retracement level at 4000.
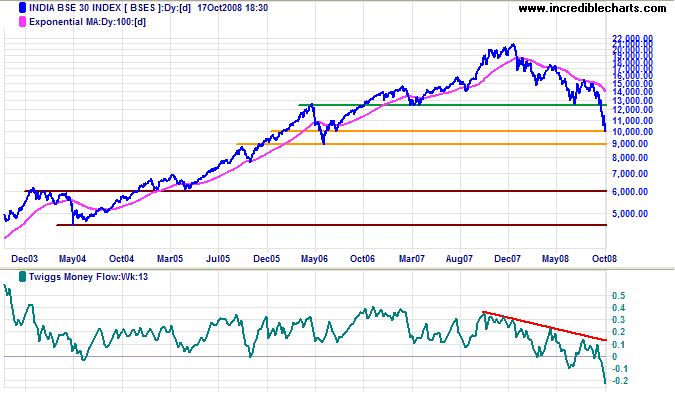
India: Sensex
The Sensex found short-term support at 10000. Failure would test 9000 in the short term. Declining Twiggs Money Flow (13-week) signals strong selling pressure. In the long term, failure of 9000 would offer a target of 6000, the 2005 low.
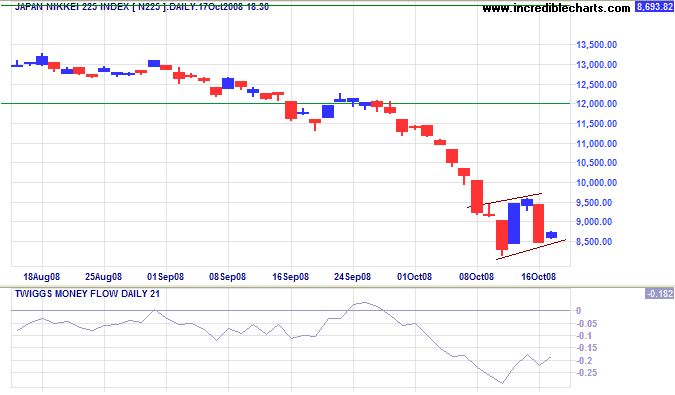
Japan: Nikkei
The Nikkei 225 displays a small flag, suggesting continuation of the down-trend. Downward breakout would test the 25-year (2003) low of 7600 in the short term. Failure of that level would suggest a target of 5500, calculated as 8500 - ( 11500 - 8500 ). Twiggs Money Flow (13-week) holding below zero indicates continued selling pressure.
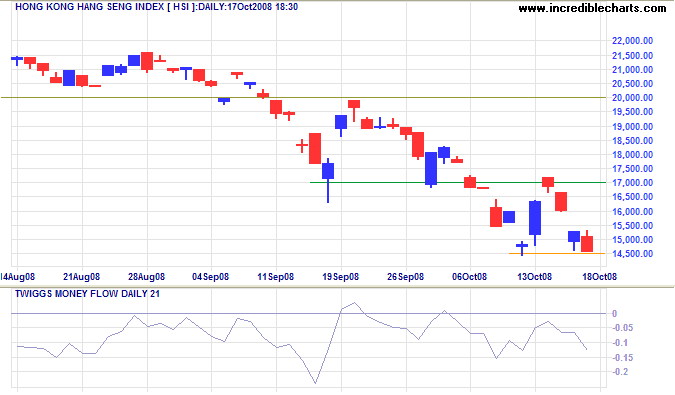
China
The Hang Seng is testing short-term support at 14500 after a brief retracement. Failure would offer a calculated target of 13000 — with the next major support level at 11000.
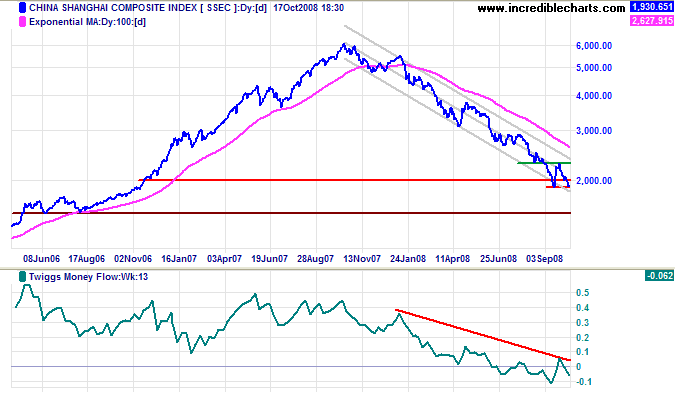
The Shanghai Composite is testing medium-term support at 1900. Failure would offer a target of the August 2006 low of 1500 — a 75 percent retracement. The target is calculated as 1900 - ( 2300 - 1900 ). With most of their global customers headed for recession, China's export-led economy is likely to follow.
Australia: ASX
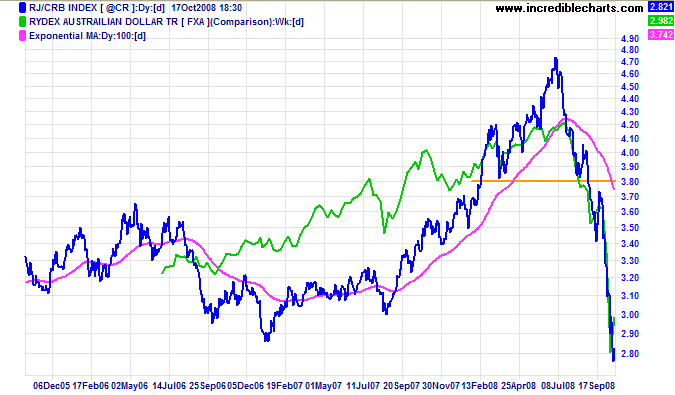
If China goes into recession, Australia will inevitably follow. The Australian economy has two main pillars: (1) property, construction and banking; and (2) mining. The first is under threat from the global credit contraction. The second is exposed to falling commodity prices, as reflected by the CRB commodities index below; though this may be offset to some extent by the falling currency.
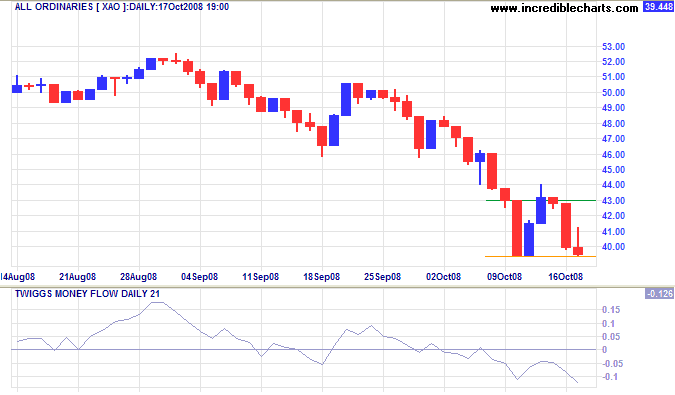
The All Ordinaries is testing short-term support at 3900, with Twiggs Money Flow (21-day) holding below zero to indicate selling pressure. Downward breakout is likely, offering a short-term target of 3700.
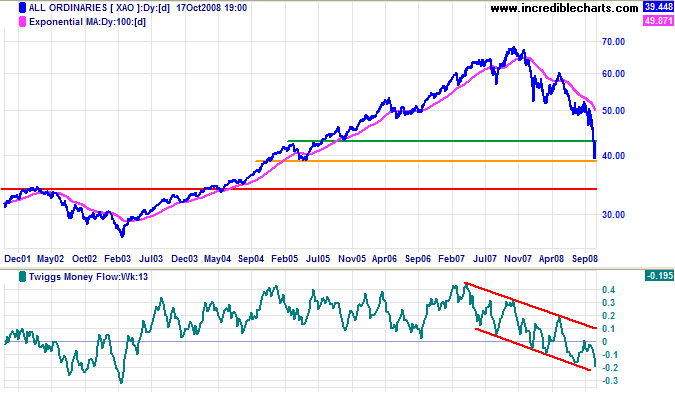
Long Term: Failure of support at 3900 would signal a test of the 50 percent retracement level at 3400. Twiggs Money Flow (13-week) respected the zero line from below, indicating strong selling pressure.
Look on the bright side
I read an article recently (I can't recall where) that may offer some consolation to readers in times like this. Recent research has shown that people are generally happier during a recession. They don't work as hard, they spend more time with their families, and are more willing to help others.
Poverty is an anomaly to rich people; it is very difficult to make out why people who want dinner do not ring the bell.
~ Walter Bagehot
