Dollar Rally
By Colin Twiggs
August 9, 1:00 a.m. ET (3:00 p.m. AET)
These extracts from my trading diary are for educational purposes and should not be interpreted as investment or trading advice. Full terms and conditions can be found at Terms of Use.
Overview
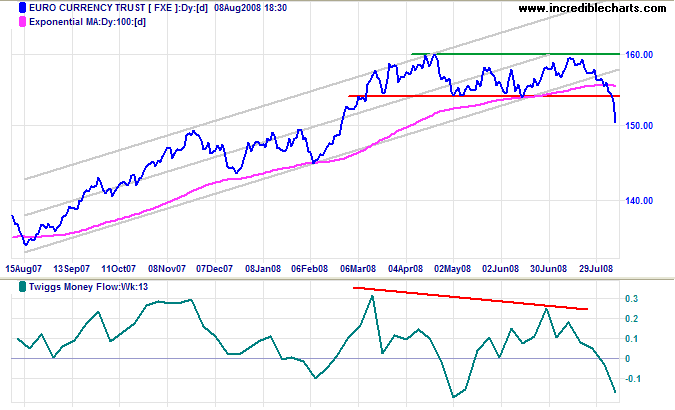
The euro broke through support at $1.53, signaling the start of a primary down-trend. Bearish divergence on Twiggs Money Flow (13-week) and breakout from the rising trend channel both confirm the signal. Expect support at $1.50 and a retracement to test the new resistance level.
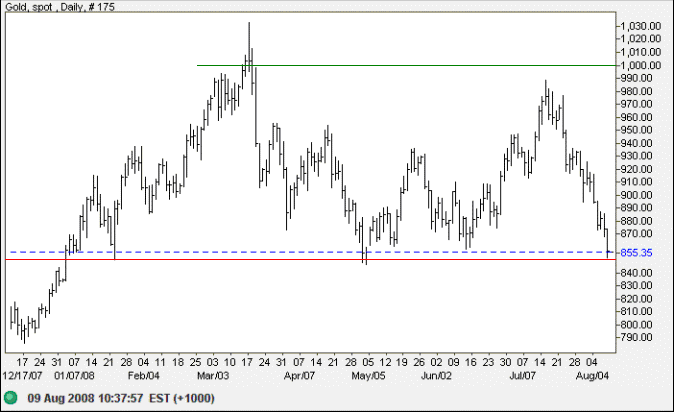
Spot gold fell in sympathy, testing support at $850/ounce. The risk of a primary down-trend is now high.
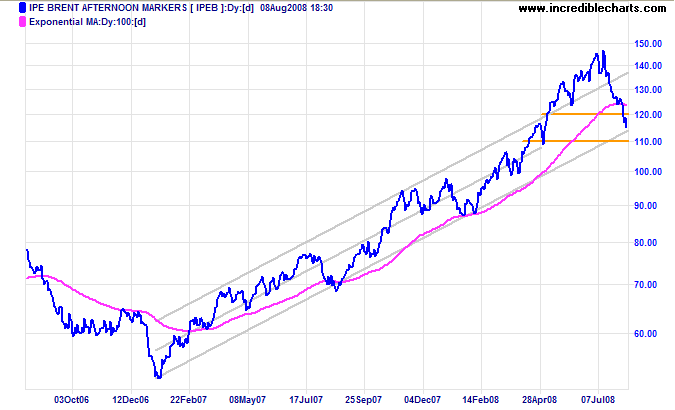
Crude oil broke through support at $120/barrel and is testing the lower trend channel. Breakout would warn that the primary up-trend is weakening. Support at $100, however, remains a significant psychological barrier.
Stock markets, with the exception of China and Japan, show short-term buying pressure — but long-term signals remain negative. We are in a bear market and this is likely to be another bear rally.
USA
Dow Jones Industrial Average
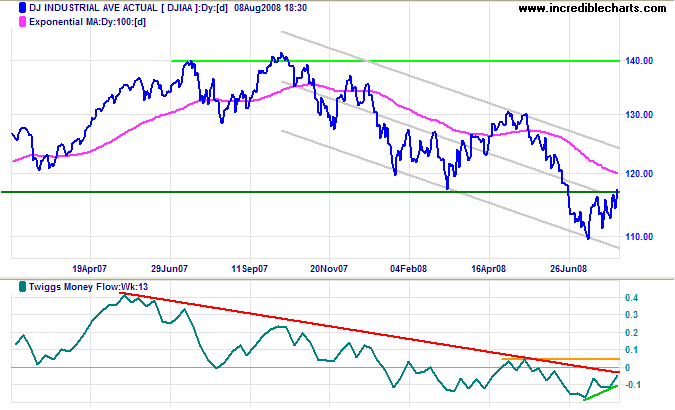
The Dow made an upward breakout from its small triangle, signaling continuation of the rally. Twiggs Money Flow (21-day) holding above zero signals short-term buying pressure.
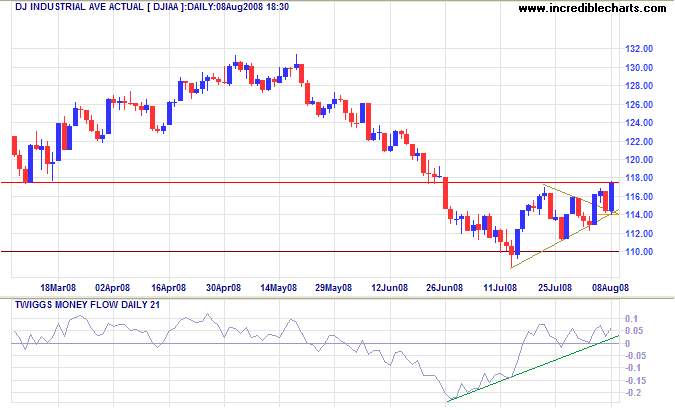
Long Term: Twiggs Money Flow (13-week) shows a small bullish trend change, signaling a secondary rally, but the long-term signal remains negative — unless the indicator rises above its previous peak at 0.05.
S&P 500
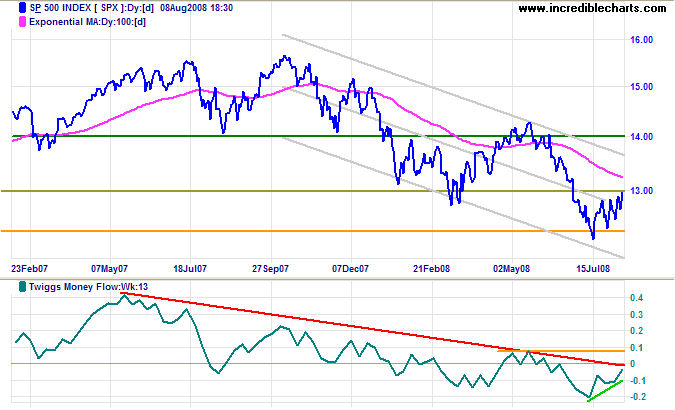
The S&P 500 displays a similar pattern on 13-week Twiggs Money Flow:
a secondary rally but bearish in the long-term
— unless there is a rise above the May peak at 0.07.
Expect a test of the upper trend channel.
Transport
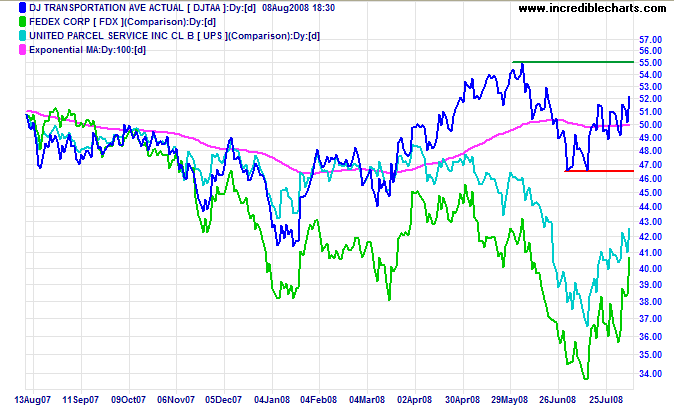
Fedex and UPS are rallying on the back of lower oil prices, but remain in a primary down-trend. A Transport Average rise above 5500 would confirm the up-trend — with positive implications for the broader economy.
Small Caps
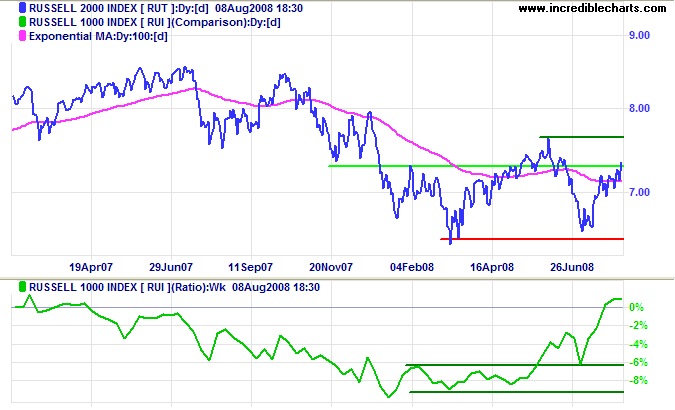
The Russell 2000 Small Caps index continues to be favored over the large cap Russell 1000. There are two reasons: first, falling energy stocks have greater representation in the large cap index; second, institutional holdings and margin trading are concentrated in large cap stocks, leaving small caps relatively untouched by the liquidity crisis (thanks to reader Kate for her help with this).
Technology
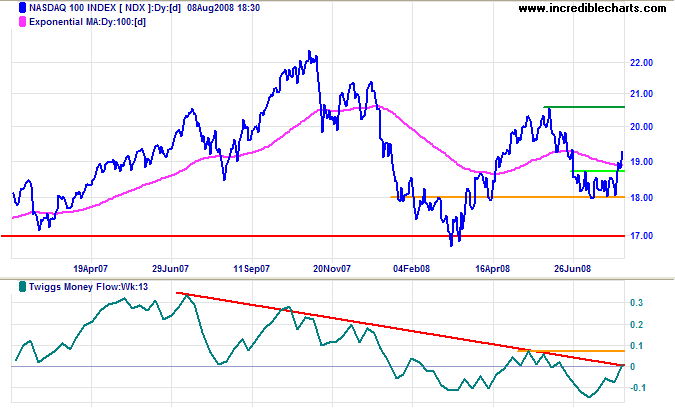
The Nasdaq 100 broke out above 1870 and is headed for a test of resistance at 2050. Penetration of 2050 would signal a primary up-trend, while a Twiggs Money Flow (13-week) rise above its previous peak at 0.7 would confirm.
Canada: TSX
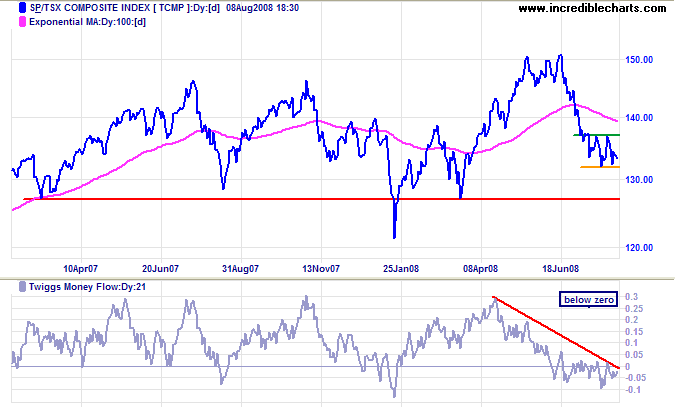
The TSX Composite continues in a bearish narrow consolidation above 13200. Twiggs Money Flow (21-day) holding below zero warns of a downward breakout and test of primary support at 12700/12600.
United Kingdom: FTSE
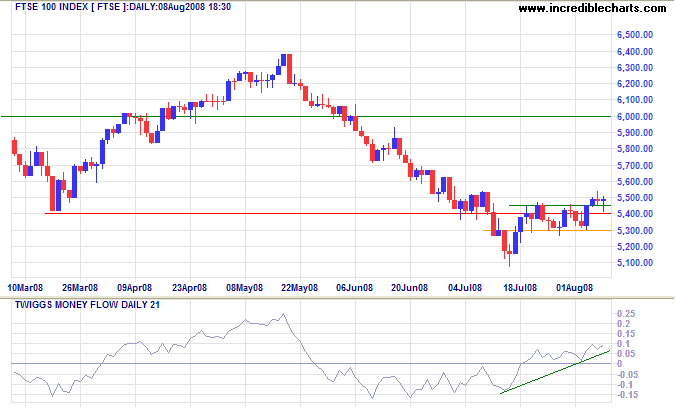
The FTSE 100 is testing support at 5500. Breakout from the recent narrow consolidation signals continuation of the bear market rally. Twiggs Money Flow (21-day) confirms short-term buying pressure, but the longer term 13-week indicator remains bearish. Reversal below 5300 is unlikely at present — and would warn of another primary down-swing, with a target of 4300.
Europe: DAX
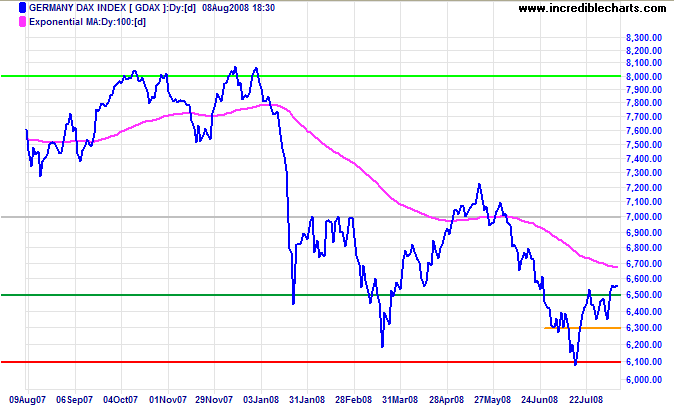
The German Dax also broke out above its narrow consolidation, indicating a test of 7000. Reversal below 6300, is unlikely at present — and would warn of another primary down-swing, with a target of 5300 (the June 2006 low).
India: Sensex
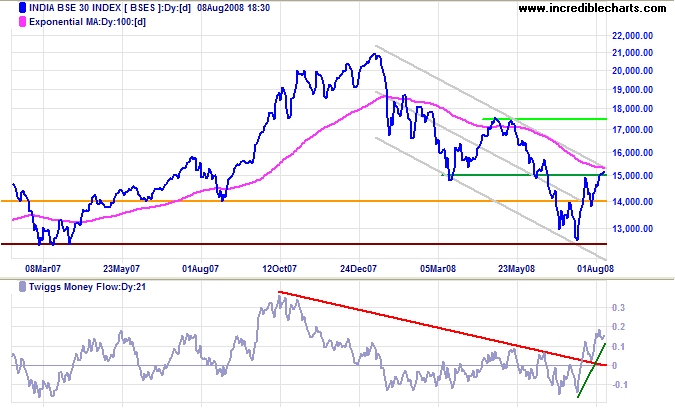
The Sensex penetrated resistance at 15000 and is testing the upper trend channel. Twiggs Money Flow (21-day) rising sharply above zero signals strong buying pressure. Breakout above the trend channel would indicate that the primary down-trend is weakening. Reversal below 14000 is unlikely at present — and would warn of another test of primary support at 12500.
Japan: Nikkei
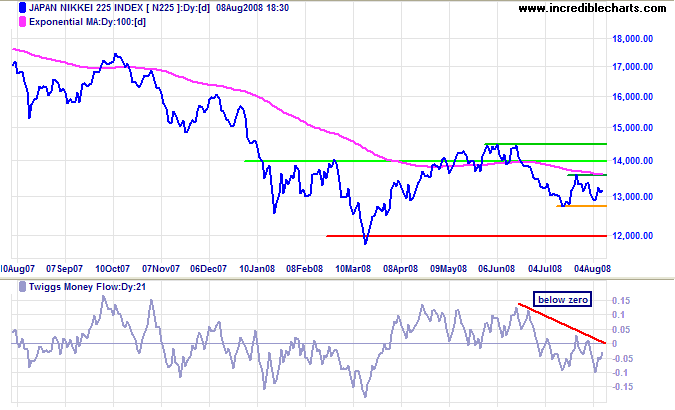
The Nikkei 225 found support at 13000. Recovery above 13600 would signal another test of 14500, while reversal below 12900 would warn of another test of primary support at 12000. Twiggs Money Flow (21-day) holding below zero indicates that support is more likely to fail.
China
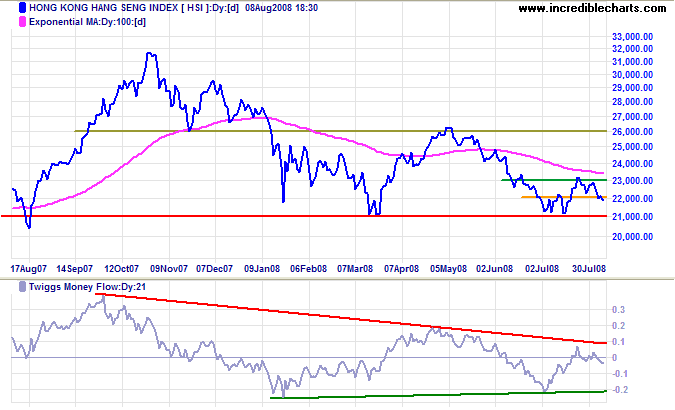
The Hang Seng reversed below support at 22000, signaling another test of primary support at 21000. Twiggs Money Flow (21-day) descending below zero indicates selling pressure. In the long term, failure of 21000 would offer a target of 16000 [21000-(26000-21000)]. Recovery above 23000 is unlikely now — and would signal a rally to 26000.
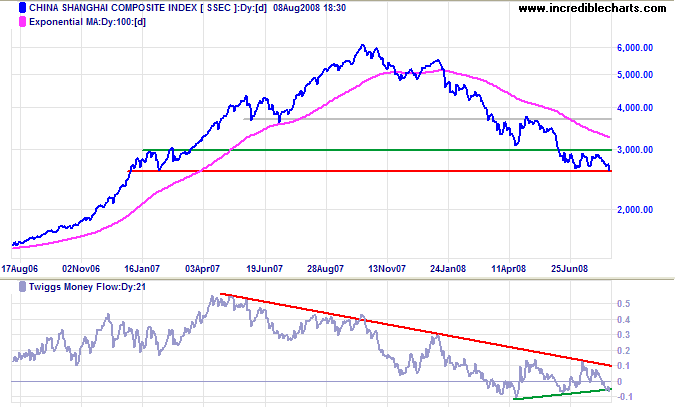
The Shanghai Composite is testing support at 2600. Downward breakout would warn of a primary down-swing, with a target of 2000. Twiggs Money Flow (21-day) below the recent triangle suggests weakness. Recovery above 3000 is now unlikely — and would offer a target of 3700.
Australia: ASX
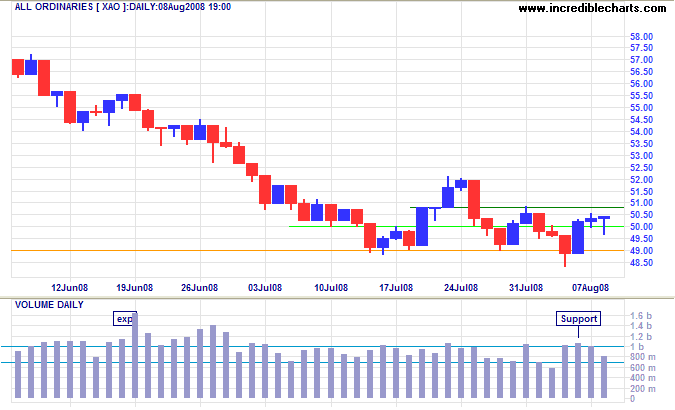
The All Ordinaries found support at 4900 — signaled by Tuesday's long tail, and strong volumes. Breakout above short-term resistance at 5080 would signal another bear market rally.
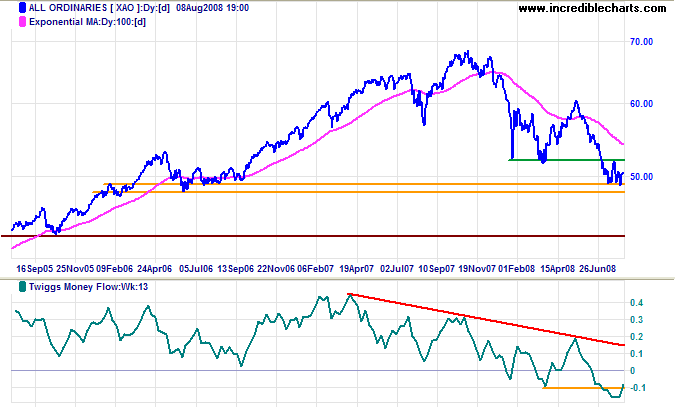
Long Term: Reversal below 4900 would offer a target of 4300 (the October 2005 low). Declining 13-week Twiggs Money Flow warns that we remain in the midst of a bear market.
Nothing is smaller than love of pleasure,
and love of gain, and pride.
Nothing is superior to magnanimity,
and gentleness, and love of mankind,
and beneficence.
~
Epictetus: Enchiridion
To understand my approach, please read About The Trading Diary.
