Crude 1 Bulls 0
By Colin Twiggs
June 7, 5:00 a.m. ET (7:00 p.m. AET)
These extracts from my trading diary are for educational purposes and should not be interpreted as investment or trading advice. Full terms and conditions can be found at Terms of Use.
Crude Oil
West Texas Intermediate Crude tested support at the rising trendline at $122 before reversing above $130 to signal another rally. The target for the breakout is $135+(135-122)=$148.
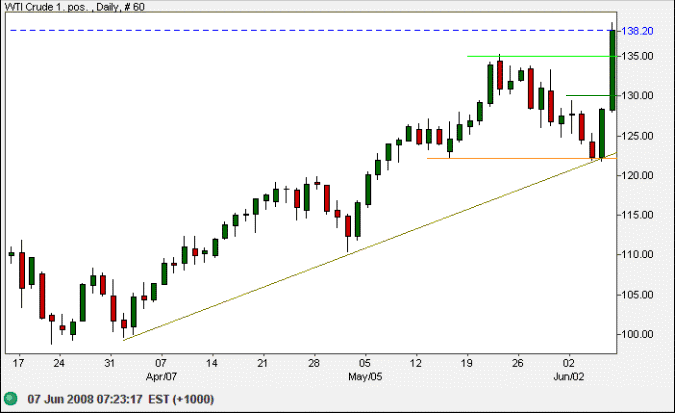
The sharp rise spooked stock markets with most major indexes weakening. Two opposing views remain, with bears dominating the Dow and FTSE 100, while bulls are evident on the NASDAQ 100, transport, small cap and Asian indexes. The bulls are not going to win though — so long as oil continues in a primary up-trend.
USA
Dow Jones Industrial Average
The Dow overcame buying support, reflected by large volumes on Friday, and is headed for a test of primary support at 11750.
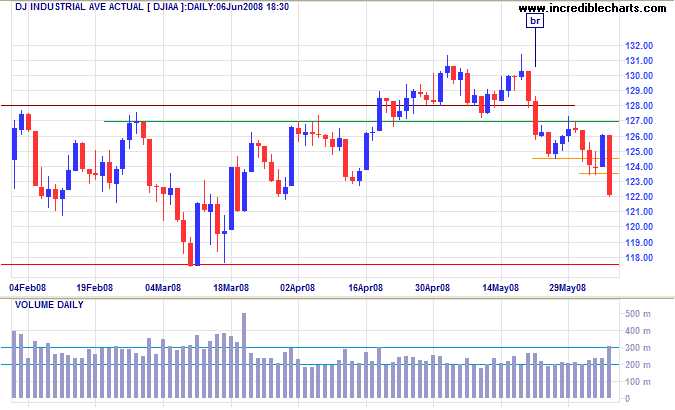
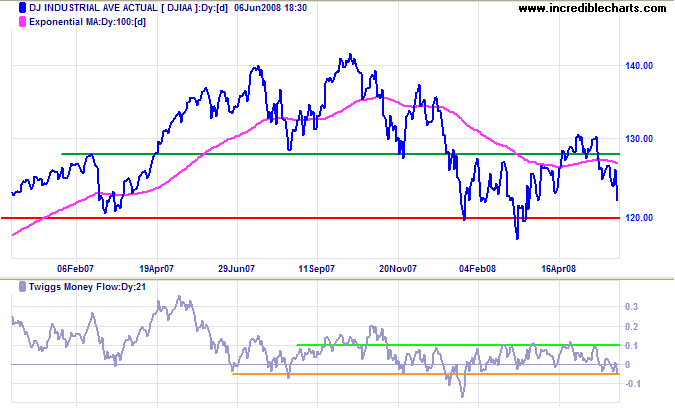
Long Term: Failure of 11750 would offer a target of 11750-(13000-11750)=10500. Twiggs Money Flow breakout below -0.05 would signal unusual selling pressure.
S&P 500
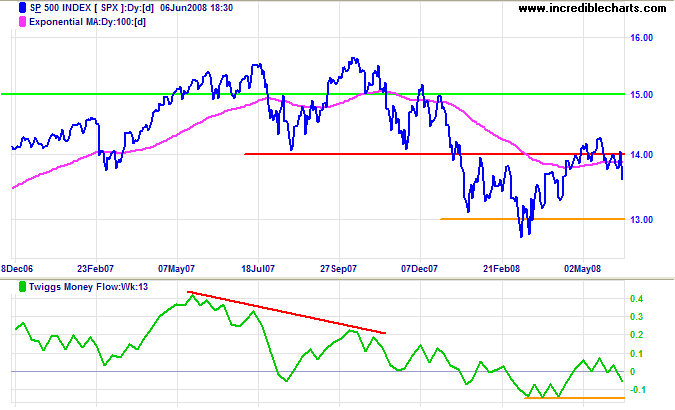
The S&P 500 confirmed the Dow signal, reversing below 1375 to warn of a test of primary support at 1270. I have been using 13-week Twiggs Money Flow more to highlight long-term accumulation and distribution. A fall below the March lows would warn of another primary decline.
Transport
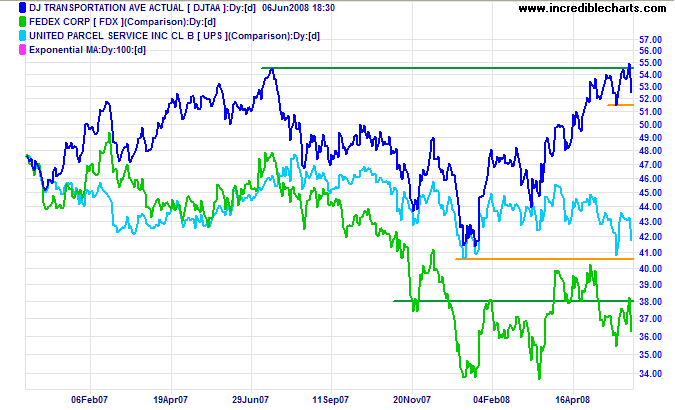
The Dow Transport index made a false break above its July 2007 high before reversing sharply. Failure of short-term support at 5150 would warn of a secondary correction. Fedex and UPS have been hurt by the spike in oil prices and are headed for a test of primary support. Downward breakout would be bearish for the Transport index and the wider economy.
Small Caps
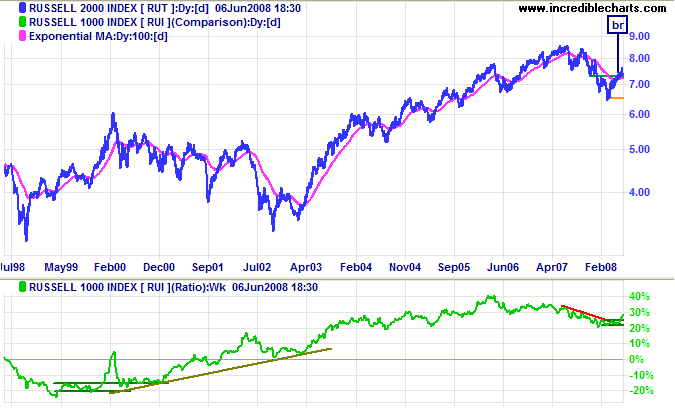
The Russell 2000 Small Caps index remains more bullish, holding above 730. The ratio to the large cap Russell 1000 is rising, indicating that small caps are favored over larger blue chip stocks. You would expect the ratio to fall during a bear market, but it rose strongly from 2000 to 2003 — and appears to be following the same pattern now.
Technology
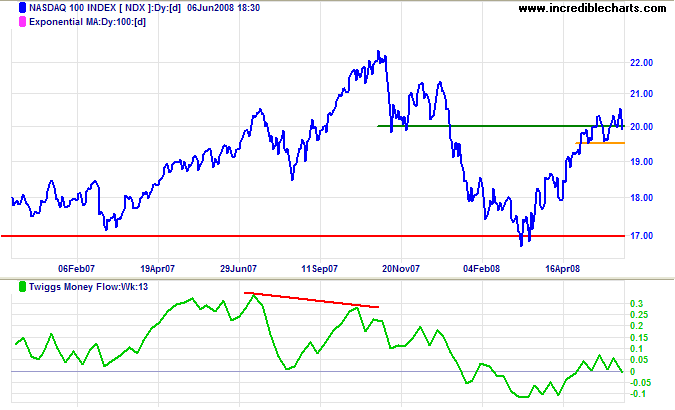
The Nasdaq 100 is whipsawing around 2000. Respect of short-term support at 1950 would signal a test of 2200, while failure would warn of a test of 1700. Twiggs Money Flow reversal below zero would warn of a secondary correction.
United Kingdom: FTSE
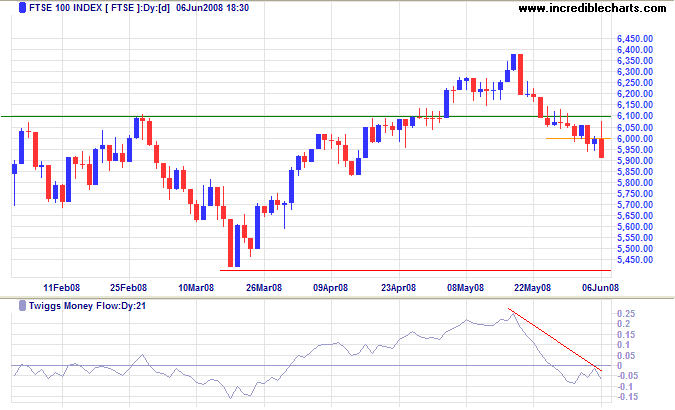
An attempted rally on the FTSE 100 was overwhelmed by sellers on Friday. Expect a test of primary support at 5400. Recovery above 6100 is unlikely — and would indicate that the secondary correction has ended. Twiggs Money Flow respecting zero from below confirms strong selling pressure.
India: Sensex
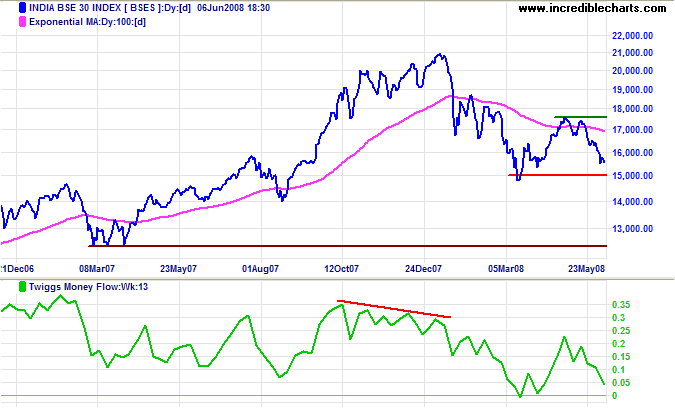
The Sensex is headed for a test of primary support at 15000/14800. Failure of support at would offer a target of 15000-(17500-15000)=12500. Twiggs Money Flow (13-week) reversal below zero would warn of another decline.
Japan: Nikkei
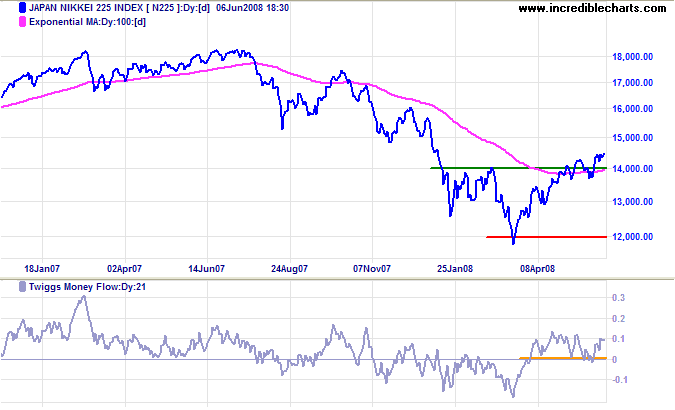
The Nikkei 225 is the most bullish of the indices covered, holding above 14000 to confirm the start of a primary advance. Twiggs Money Flow oscillating above the zero line signals buying pressure.
China
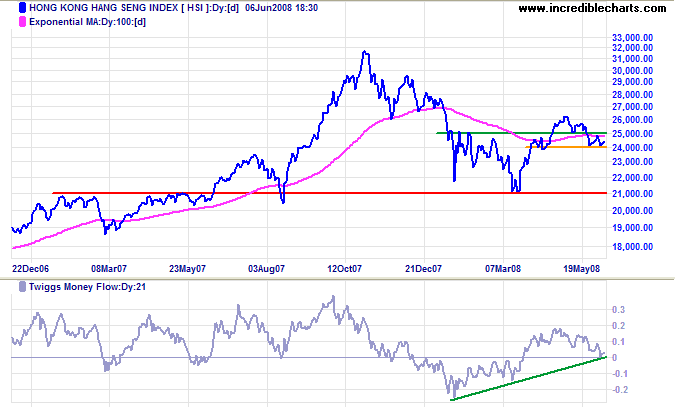
The Hang Seng continues to test short-term support at 24000. Failure would warn of a test of primary support at 21000, while recovery above 25000 would confirm the start of a primary advance. Extended consolidation between 24000 and 25000 would be a bear signal. Twiggs Money Flow reversal below zero would warn of selling pressure.
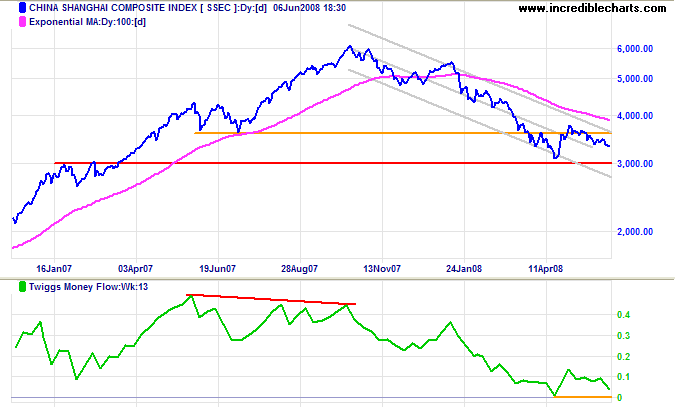
The flag continuation pattern on the Shanghai Composite, accompanied by typical declining volume, is approaching the end of its shelf-life (5 weeks). Upward breakout, accompanied by increased volume, would signal the start of an up-trend. Twiggs Money Flow (13-week) is falling, however, indicating selling pressure. Reversal below zero would warn of another primary decline.
Australia: ASX
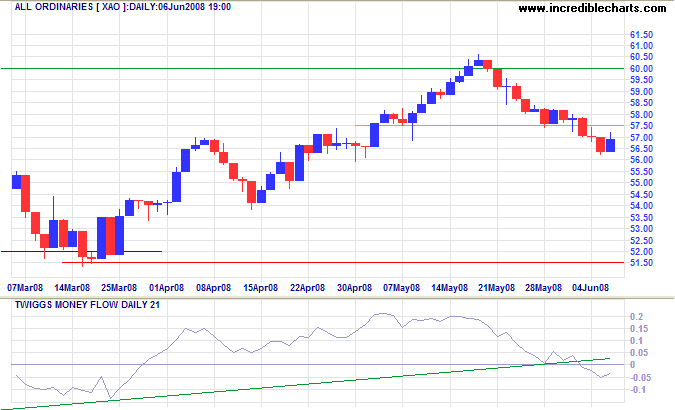
The All Ordinaries broke through support at 5750, signaling a secondary correction. Twiggs Money Flow (21-day) fall below zero warns of selling pressure.
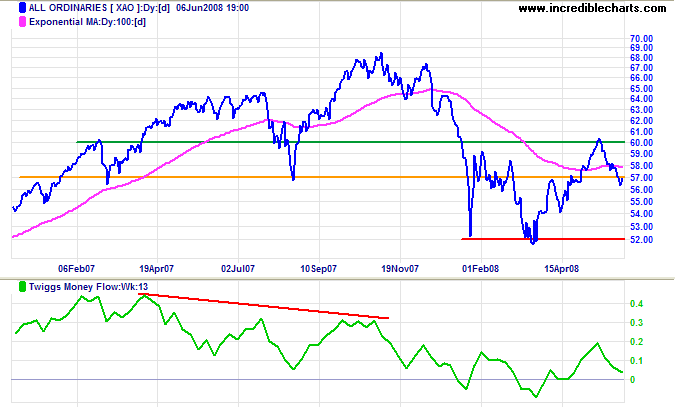
Long Term: Failure of primary support at 5200 would offer a target of 5200-(6000-5200)=4400. Twiggs Money Flow (13-week) fall below its March low would warn of another primary decline.
Lord, the money we do spend on Government
and it's not one bit better than the government
we got for one third the money twenty years ago.
~ Will Rogers.
To understand my approach, please read About The Trading Diary.
