Dow Hesitancy
By Colin Twiggs
May 10, 4:00 a.m. ET (6:00 p.m. AET)
These extracts from my trading diary are for educational purposes and should not be interpreted as investment or trading advice. Full terms and conditions can be found at Terms of Use.
USA
Dow Jones Industrial Average
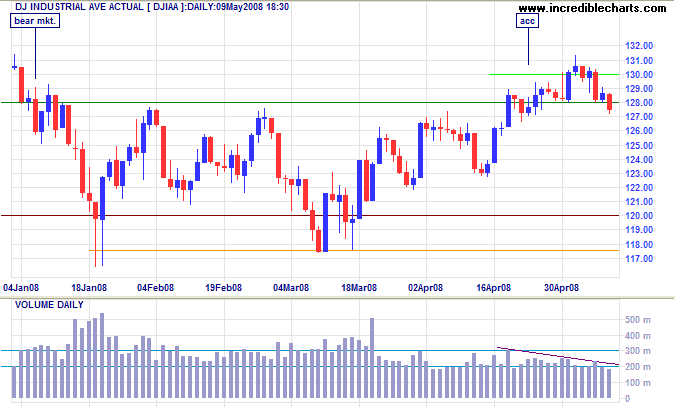
The Dow reversed below the new support level at 12800 on low volume, signaling an absence of buyers. The breakout signal (above 12800) still stands, but reversal below short-term support at 12700 would warn of a bull trap. Look for confirmation from the S&P 500.
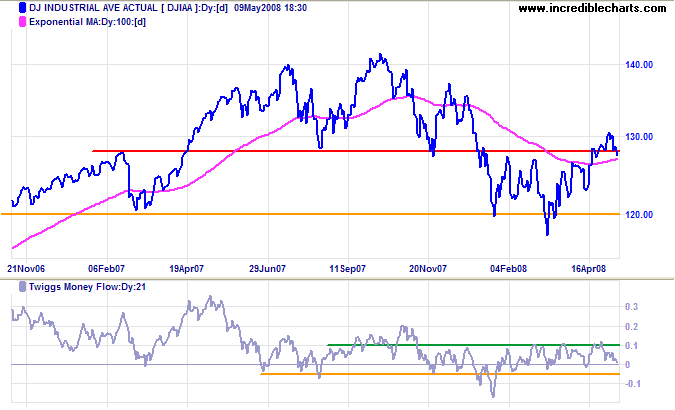
Long Term: A bull trap would test support at 12000, while recovery above 13000 would indicate a primary advance. Twiggs Money Flow respect of the zero line would reflect buying pressure, while a fall below -0.05 would warn that sellers have taken control.
S&P 500
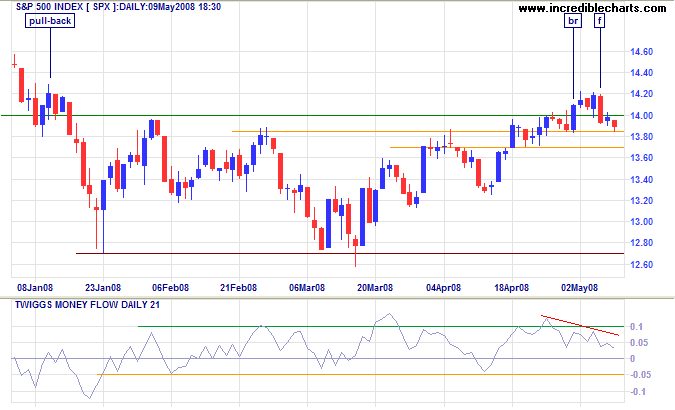
The S&P 500 retraced below the new support level at 1400. Markets often reflect hesitancy after an important breakout. The pull-back after a downward breakout in early January is a typical example. This is significant only where short-term support (or resistance in January) is broken. In this case there are two weak support levels in close proximity, at 1385 and 1370, so we select the lower. Twiggs Money Flow highlights short-term selling but this would only be cause for concern if the indicator fell below recent lows at -0.05.
Transport
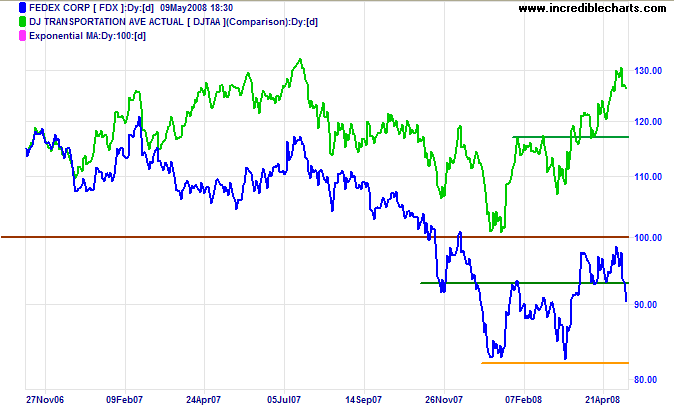
Fedex dropped sharply on the strength of recent oil price hikes, signaling trend weakness. Expect a test of primary support at $82.00. Both the lead indicator and the broader Dow Transport index remain in primary up-trends — for the present — confirming the Dow up-trend.
Small Caps
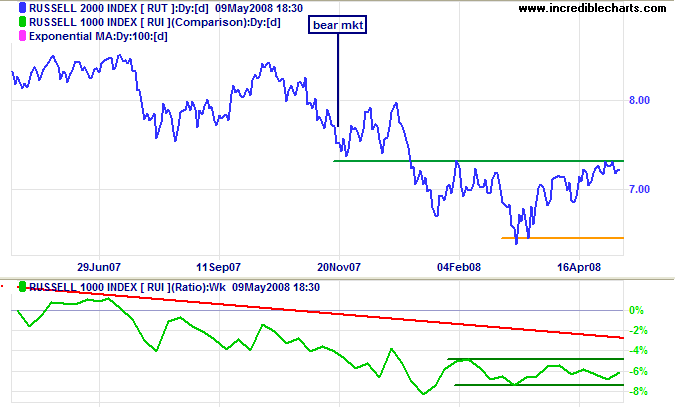
The Russell 2000 Small Caps index continues to test primary resistance at 730. The ratio to the large cap Russell 1000 remains range-bound, indicating a stable market weighting between large and small caps.
Technology
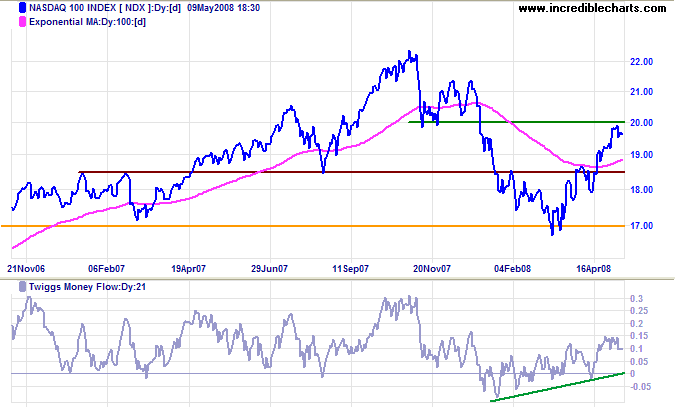
The tech-heavy Nasdaq 100 continues to out-perform the broader market, testing resistance at 2000. Breakout would signal a test of 2200. Twiggs Money Flow reflects strong buying pressure, but this may be countered by the bearish influence of the Dow.
United Kingdom: FTSE
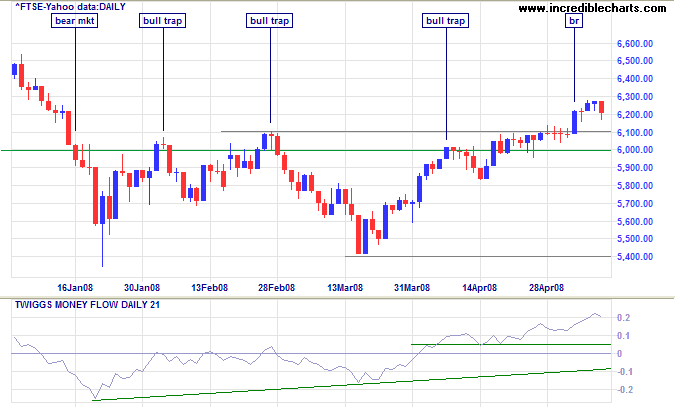
The FTSE 100 broke through 6100 before retracing to test the new support level. Respect of 6000 would signal a test of 6750. Penetration, while unlikely, would warn of a test of 5500. Twiggs Money Flow shows strong buying pressure.
India: Sensex
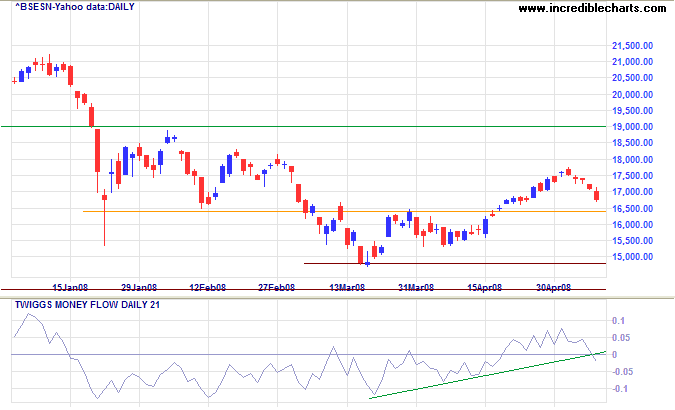
The Sensex is retracing to test the new support level at 16500. Respect would signal a test of 19000; penetration would signal a test of 14800. Twiggs Money Flow below the zero line reflects short-term selling pressure.
Japan: Nikkei
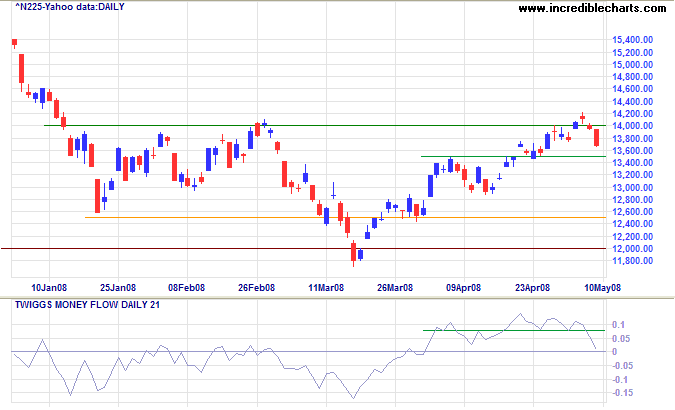
The Nikkei 225 retreated below 14000. A bull trap would be confirmed if short-term support at 13500 is penetrated, warning of a test of 12000. Reversal above 14000, while not expected, would confirm the primary up-trend. The sharp drop on Twiggs Money Flow reflects short-term selling pressure — strengthened if the indicator crosses below zero.
China
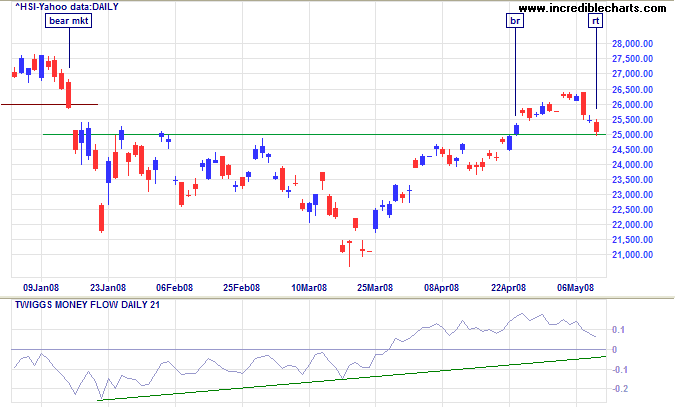
The Hang Seng retraced to test the new support level at 25000. Respect would offer a long-term target of last year's high at 31500; failure would warn of a test of primary support at 21000. Twiggs Money Flow above zero for the past month shows medium-term buying pressure.
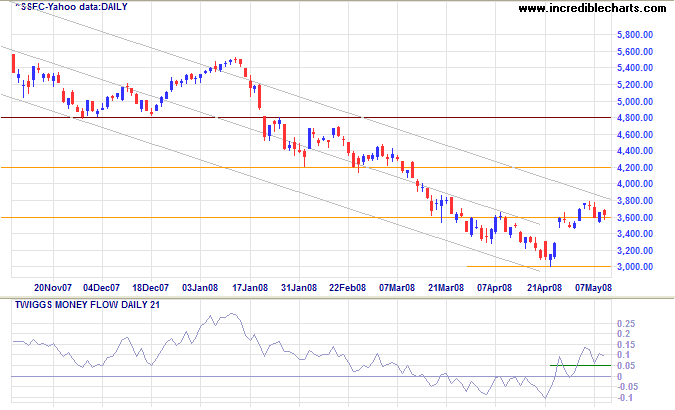
The Shanghai Composite is testing support at 3600. Respect would indicate a breakout above the upper trend channel. Failure would signal a test of 3000 — and the lower channel. Twiggs Money Flow continued respect of the zero line shows that buyers dominate; reversal below zero would warn of selling pressure.
Australia: ASX
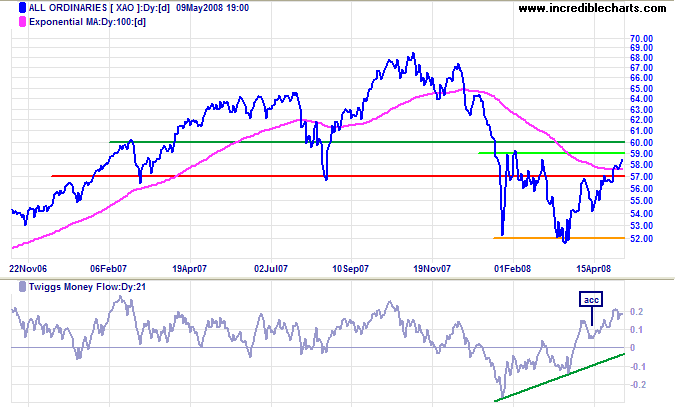
The All Ordinaries broke through short-term resistance at 5800 and is headed for a test of primary resistance at 5900/6000. Reversal below 5700 is not expected unless we see a sharp fall on the Dow — and would warn of a test of 5200.
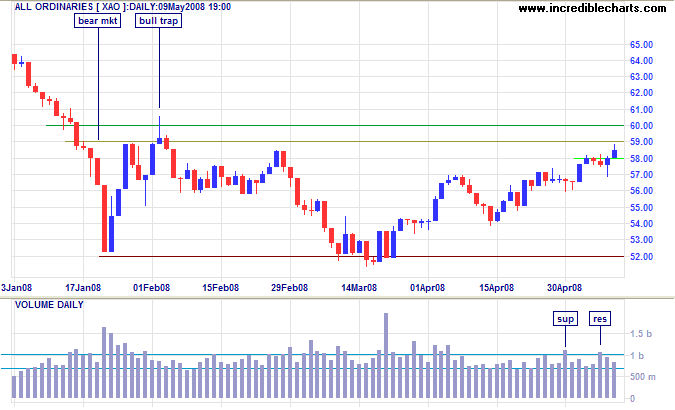
Long Term: Breakout above 6000 would signal reversal to a primary up-trend, offering an initial target of 6800. Twiggs Money Flow reflects strong medium-term buying pressure.
Let it be your constant method to look into the design of people's actions,
and see what they would be at, as often as it is practicable;
and to make this custom the more significant, practice it first upon yourself.
~ Marcus Aurelius,
Meditations
To understand my approach, please read About The Trading Diary.
