$1 Trillion
By Colin Twiggs
April 10, 2008 5:00 a.m. ET (7:00 p.m. AET)
These extracts from my trading diary are for educational purposes and should not be interpreted as investment or trading advice. Full terms and conditions can be found at Terms of Use.
The Credit Crunch
The IMF, Moody's and Goldman Sachs estimate that banks, insurance companies, pension funds and other investors collectively stand to lose as much as $1 trillion dollars worldwide, during the current credit crisis. While the figure rolls easily off the toungue, we need to remind ourselves that this is a million x $1 million — or the annual GDP of a medium-sized economy like Australia, India or South Korea. With only about $200 billion of write-downs reported so far, it would be advisable to stay clear of the financial and insurance sector until the dust has settled.
The Fear Index
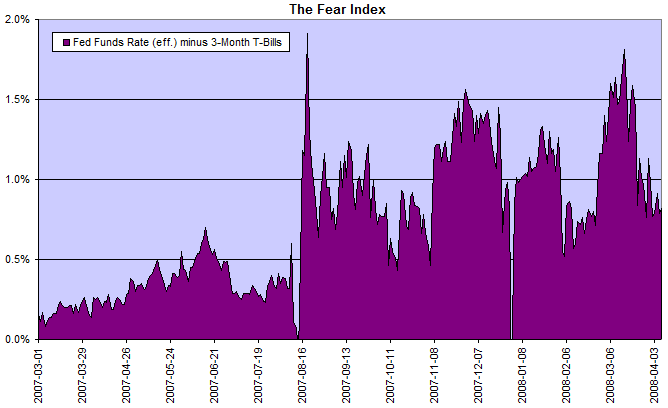
The spread between the fed funds rate and 3-month T-bills has eased. The risk level has subsided from red (above 1%) to amber (0.5% to 1%). Investors continue to favor the safety of treasury securities against significantly higher yields in the inter-bank and commercial paper markets.
Treasury Yields
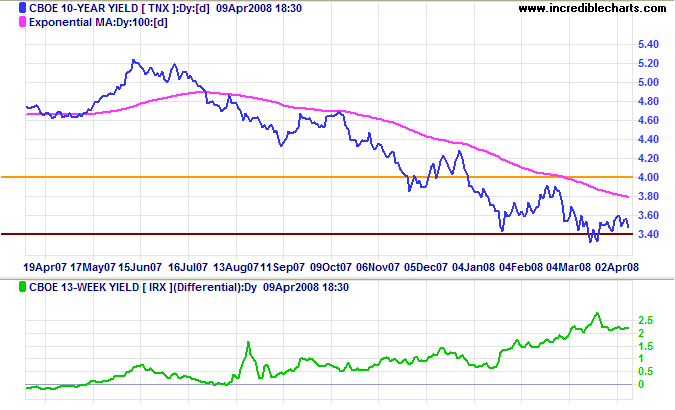
Ten-year treasury yields are testing support at 3.30%/3.40%. Respect of this level would be the first positive sign for some time. The high yield differential shows that bank margins have recovered, but financial markets will continue to suffer the after-effects of the 2006/2007 negative yield differential for most of 2008.
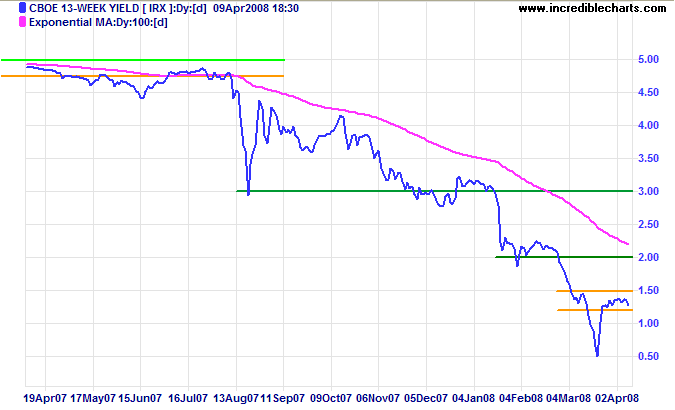
Three-month treasury bill yields continue to consolidate between 1.20% and 1.50%. A fall below 1.20%, ahead of another rate cut, would warn of further instability in financial markets.
Financial Markets — Commercial Paper
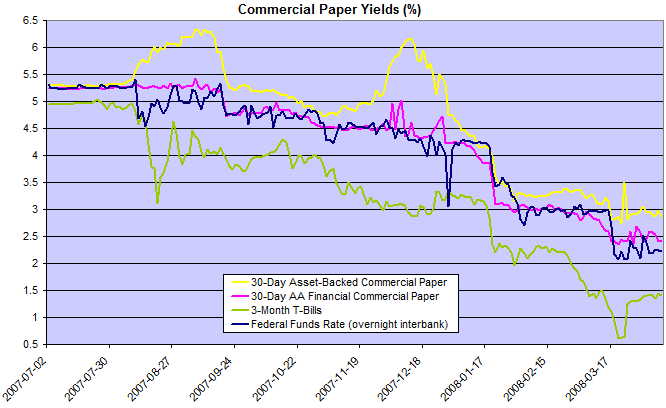
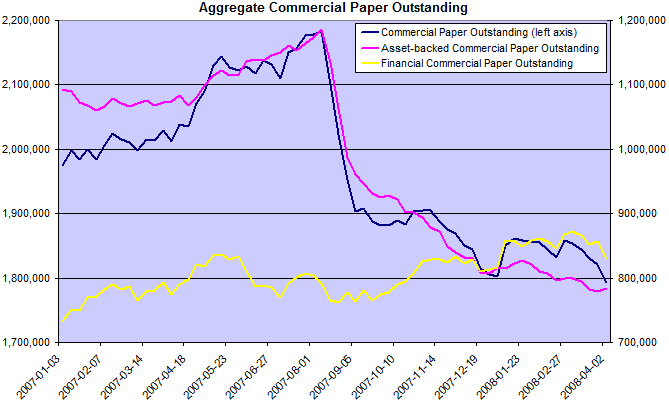
Asset-backed and financial commercial paper yields are now noticably higher than the fed funds rate. Markets are pricing in a risk premium not normally seen in a stable market.
Total asset-backed commercial paper is again falling, placing pressure on bank balance sheets as corporate clients look to them for replacement finance.
Corporate Bonds
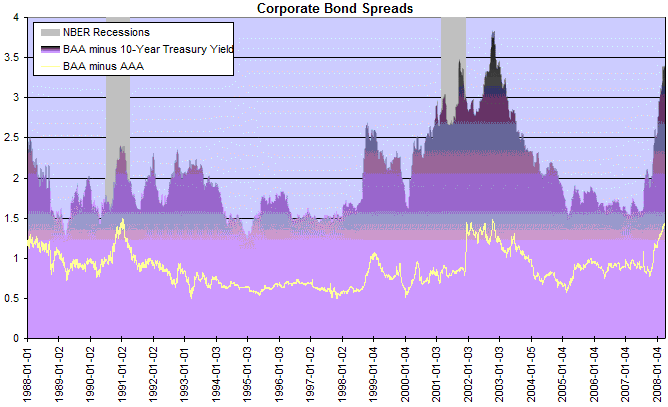
Corporate bond spreads continue to rise. This will impact on current earnings as well as curtailing new investment.
Housing
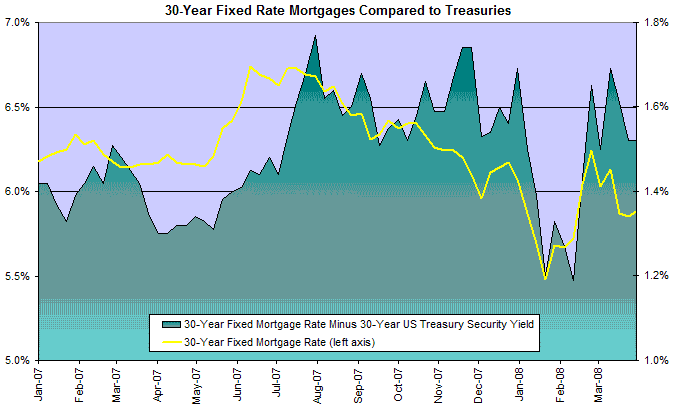
The 30-Year Fixed Mortgage Rate spread with 30-Year Treasury Bonds remains high — indicating continued aversion to lending in the housing market.
Commercial Real Estate
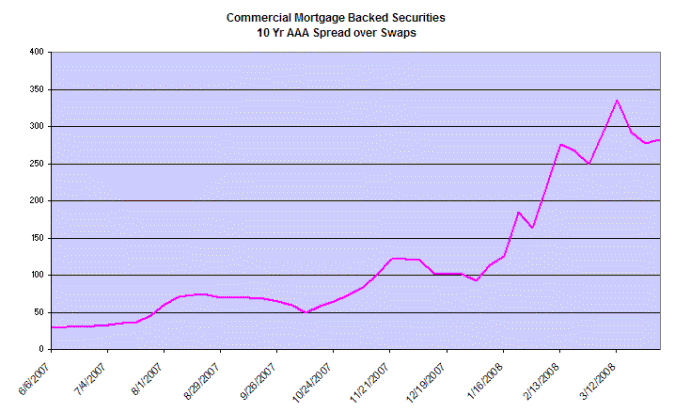
Commercial mortgage-backed securities reflect a similar trend to the corporate bond market, with the spread over the 10year swap rate holding above 250 basis points.
Bank Credit
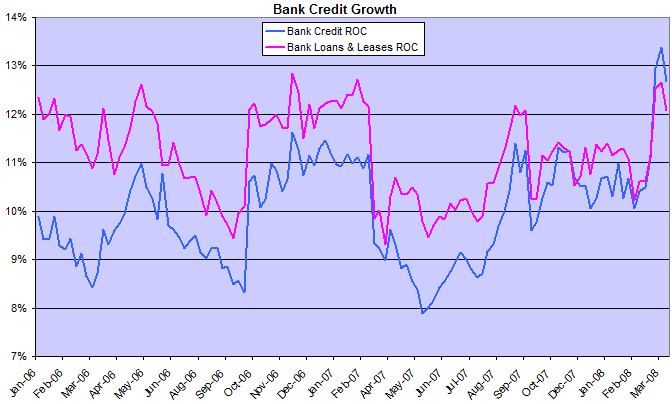
Bank credit growth remains high, but the real situation is obscured by the reduction in off-balance sheet funding.
Consumer Credit
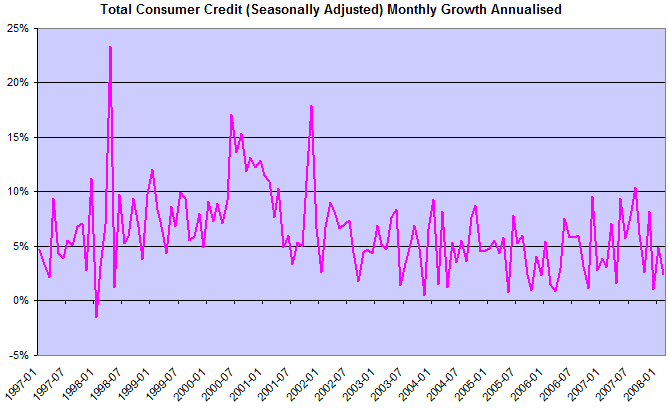
Consumer credit growth is declining. A fall below zero would warn of recession.
Employment
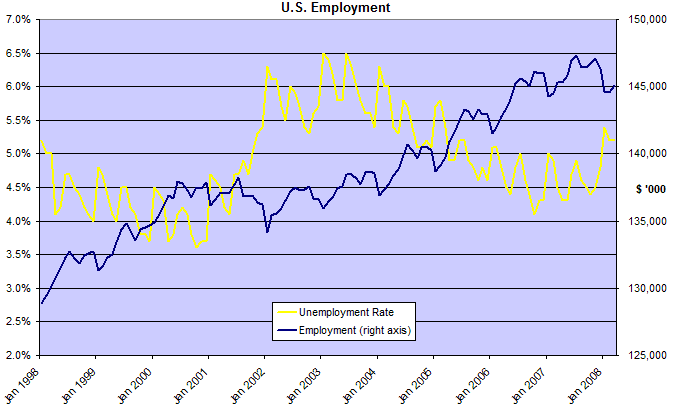
Unemployment rose above 5%, signaling the start of an up-trend after higher lows in 2007. Employment respected the previous low and is likely to consolidate, as in recent recessions, rather than trend downwards — which would warn of a depression.
Wright Model
Jonathan Wright's recession prediction model shows
probability of a recession in the next four quarters remains at a low 1 percent.
There appears to be some confusion about the model, which looks one year ahead.
The spike in late 2007 relates to the current crisis, but I believe that this understated the probability
of a recession — and should have registered as high as 80 percent.
The reason is that the model underestimates the damage
a negative yield curve can cause in a low interest rate environment.
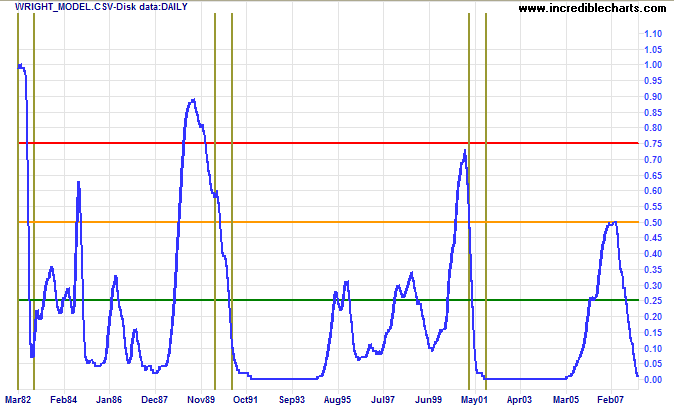
I would prefer to stop publishing the model. Some readers, however, have indicated that they still find the chart useful; so I continue to include it for their benefit.
....There is no long-run trade-off between the rate of inflation and the rate of unemployment.
In other words, the unemployment rate will average about the same amount,
whether the average inflation rate is zero percent or, say, ten percent.
~ John B Taylor: Inflation, Unemployment, and Monetary Policy.
To understand my approach, please read Technical Analysis & Predictions in About The Trading Diary.
