Scraping The Barrel
By Colin Twiggs
March 20, 3:00 a.m. ET (7:00 p.m. AET)
These extracts from my trading diary are for educational purposes and should not be interpreted as investment advice. Full terms and conditions can be found at Terms of Use.
I have combined the normal stock markets (Saturday) and yields & spreads (Thursday) newsletters because of the long weekend.
USA
The Fed cut their target rate by 75 basis points to 2.25% and
are now close to the bottom of the barrel. Their hope is to
inflate the economy out of trouble, but risk causing the dollar
serious harm. If the crisis continues, with their ammunition
all but spent, the Fed will soon have to pass the problem along
to the Treasury Department. A taxpayer-funded bailout then
becomes almost inevitable, despite concerns over moral hazard.
To discourage a repeat of the financial sector game of "heads I
win, tails the taxpayer loses", they are likely to ensure that
shareholders and senior executives do not escape
unscathed.
Inflation expectations are rising and negative real interest
rates (where inflation exceeds the nominal interest rate) have
already fuelled a sharp increase in commodity prices. It may be
some time, however, before speculators are bold enough to
venture back into the traditional inflation hedges of stocks
and real estate.
This week the Fed opened the discount window to brokerage
houses who have been at the sharp end of the liquidity squeeze.
The Wall Street Journal reports that leverage ratios for some
major firms had run as high as 33-to-1, a precarious position.
Flight To Safety
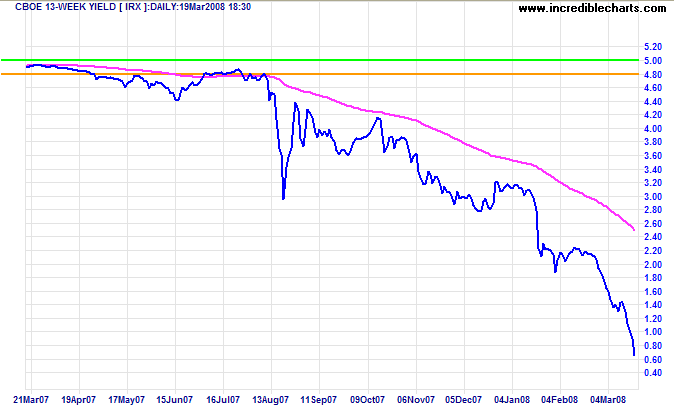
Investors wary of counter-party risk drove Treasury Bill rates down to 0.70%, the lowest level in my 30 years of data. The discount rate could theoretically go negative (where investors bid over par for the bills), but this is unlikely to ever happen. Extremely low rates would precipitate a shift to hard currency — with possible disastrous consequences for banks.
The rising differential between the fed funds rate and 1-month T-bills warns of increased financial market uncertainty.
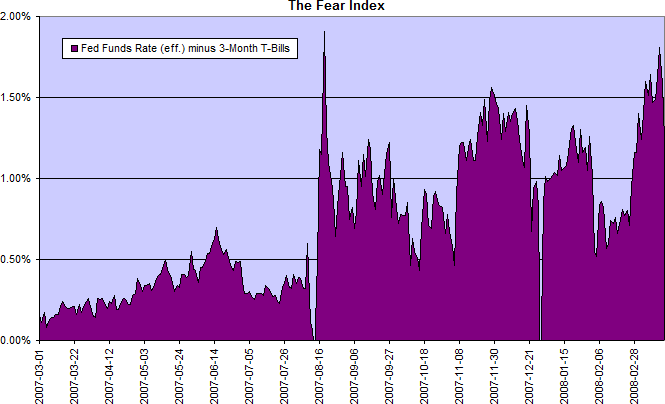
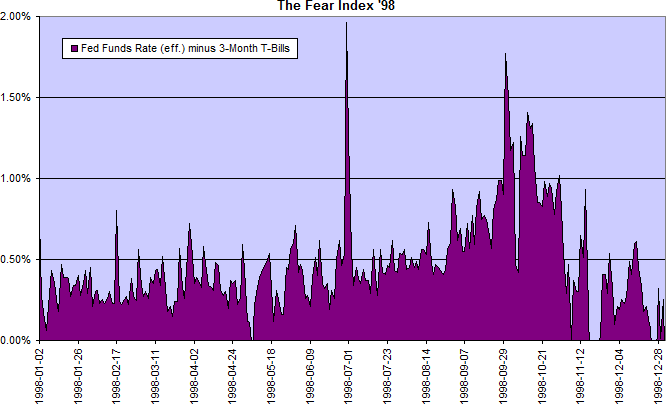
Readings over 1% indicate an unstable market. Compare the above readings to the LTCM crisis in 1998.
Gold
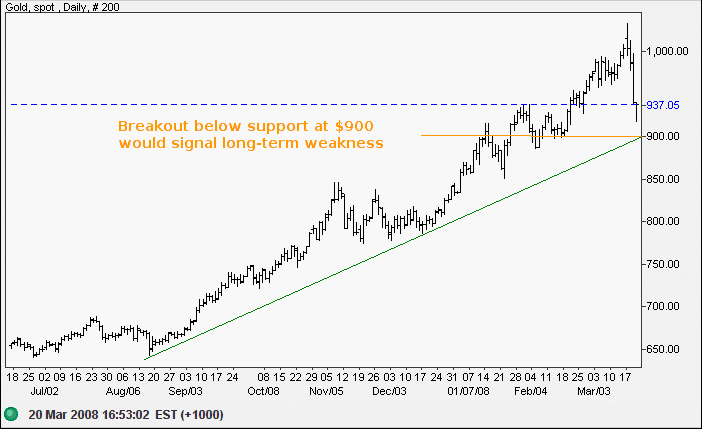
Gold and other commodities were sold down sharply this week in response to Fed actions. The spot price is now testing the long-term rising trendline — expect support at $900. Breakout (not just intra-day lows) below this level would signal weakness in the primary trend.
Dow Jones Industrial Average
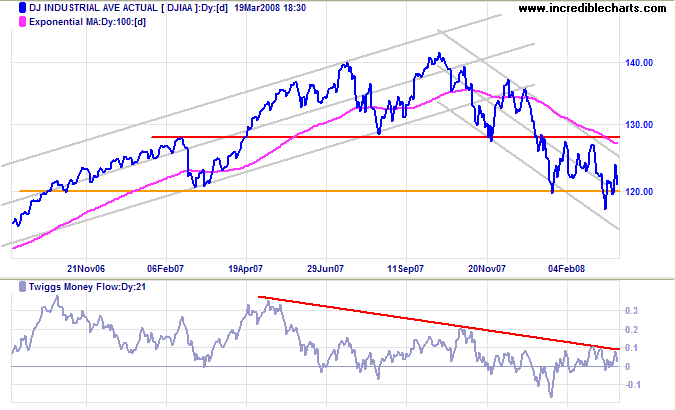
The Dow gave back most of the gains from this week's rally and is likely to test support at the January intra-day low of 11650. Recovery above 12400 is not expected — and would signal a test of 12800.
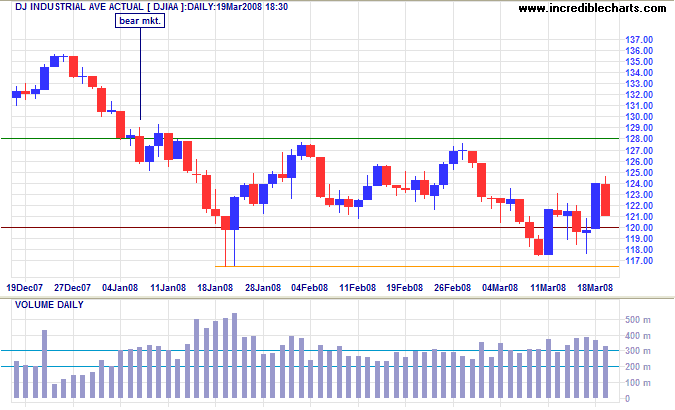
Long Term: Breakout below 11650 would confirm the medium-term target of 12000-(12800-12000)=11200. Twiggs Money Flow warns that long-term selling pressure continues.
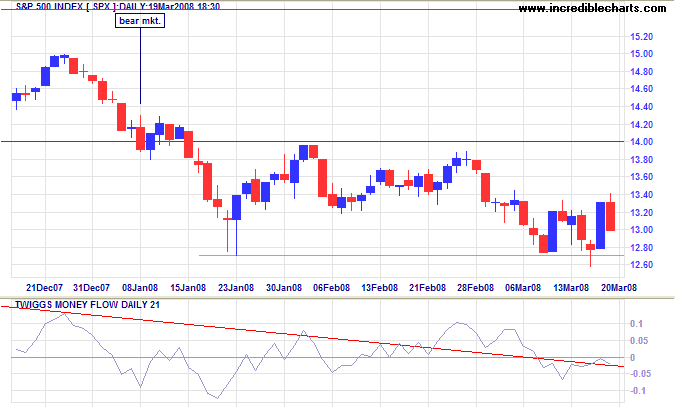
S&P 500
The S&P 500 is similarly headed for a test of support at 1270. Failure would confirm the medium-term target of 1300-(1400-1300)=1200. Twiggs Money Flow indicates long-term selling pressure.
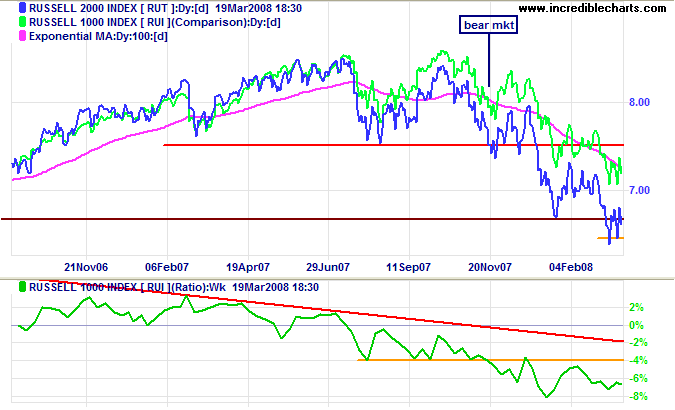
Small Caps
The Russell 2000 is headed for a test of support at 650. Failure would signal another down-swing with a target of 650-(750-650)=550. Narrow consolidation favors continuation of the down-trend. The falling ratio against the Russell 1000 reflects migration to (relative) safety of large cap stocks.
Technology
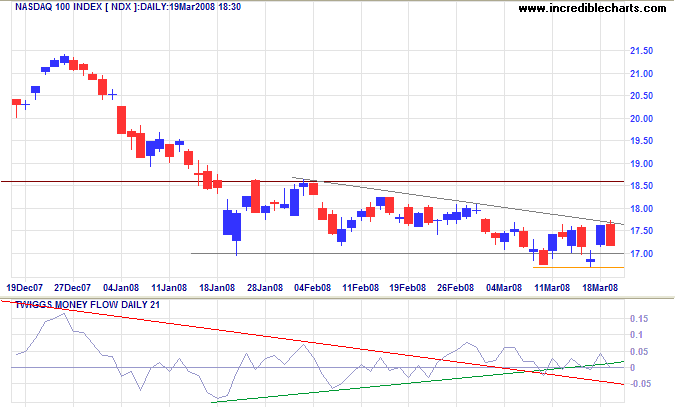
A Nasdaq 100 breakout below short-term support at 1670 would confirm the down-swing — with a target of the July 2006 low at 1450. Twiggs Money Flow whipsawing around zero signals uncertainty.
Transport
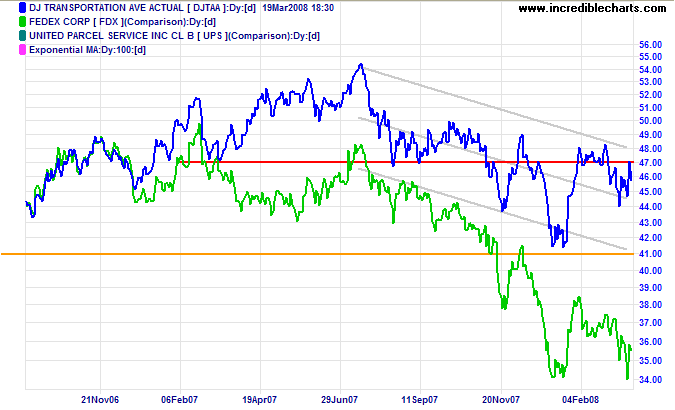
The Dow Jones Transportation Average appears headed for a test of the upper border of the trend channel, while lead indicator Fedex continues a strong primary down-trend.
United Kingdom: FTSE
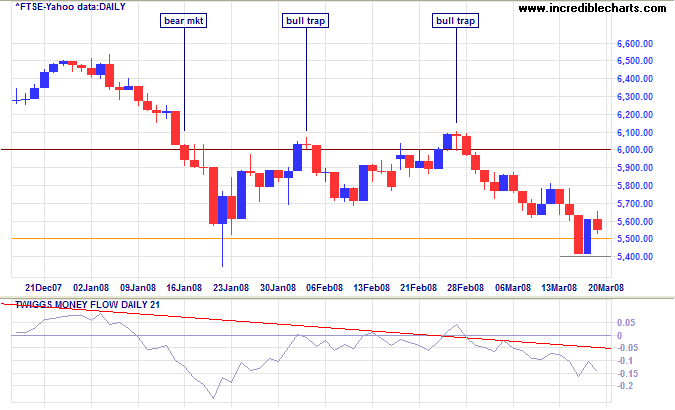
The FTSE 100 is headed for a test of short-term support at 5400. Twiggs Money Flow holding below zero warns of long- and short-term selling pressure. Failure of support would offer a (medium-term) target of 5500-(6000-5500)=5000.
India: Sensex
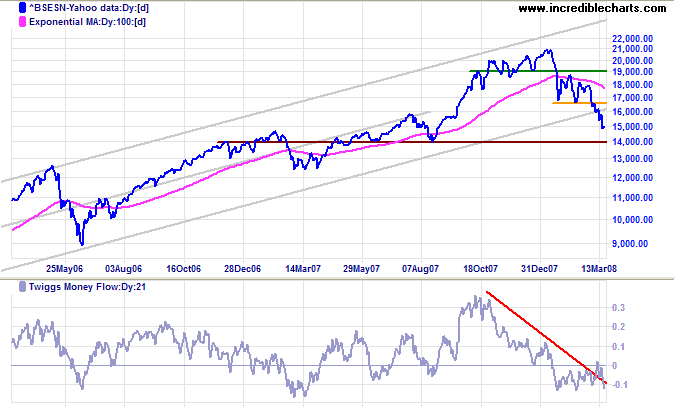
The Sensex broke out of its long-term rising trend channel and is headed for a test of support at the medium-term target of 16500-(19000-16500)=14000, the August 2007 low. Twiggs Money Flow holding below the zero line warns of short- and long-term selling pressure.
Japan: Nikkei
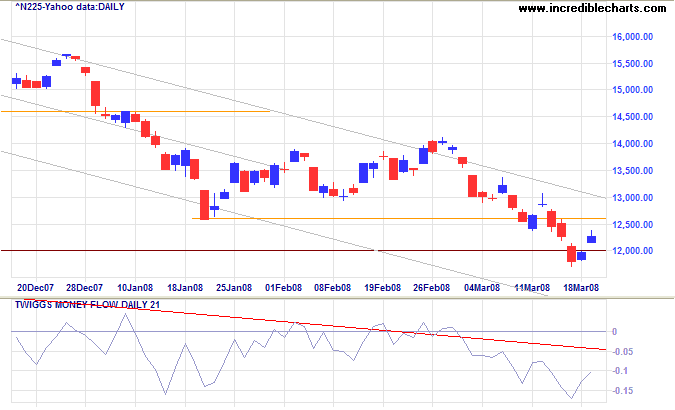
The Nikkei 225 encountered short-term support at the
original (2005) breakout level of 12000. Failure would offer a
target of 12600-(14600-12600)=10600, but the index may first
undergo consolidation between 12000 and 12500.
Twiggs Money Flow signals strong selling pressure.
China: Hang Seng & Shanghai
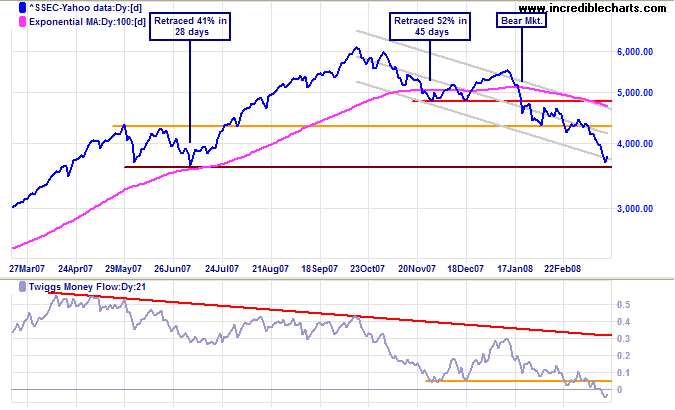
The Shanghai Composite found support at the medium-term target of 3600 (from July 2007). Expect consolidation or even a rally to test the upper trend chnnel, but Twiggs Money Flow falling below zero warns of continued long-term selling pressure.
Australia: ASX
The All Ordinaries encountered strong selling as a result of the commodities sell-off. Narrow consolidation above support favors continuation of the down-trend.
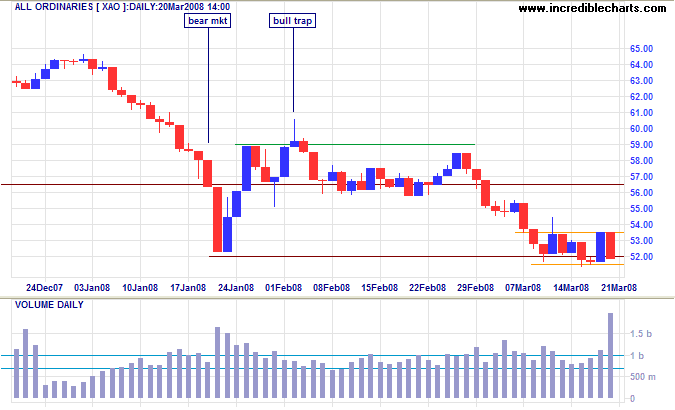
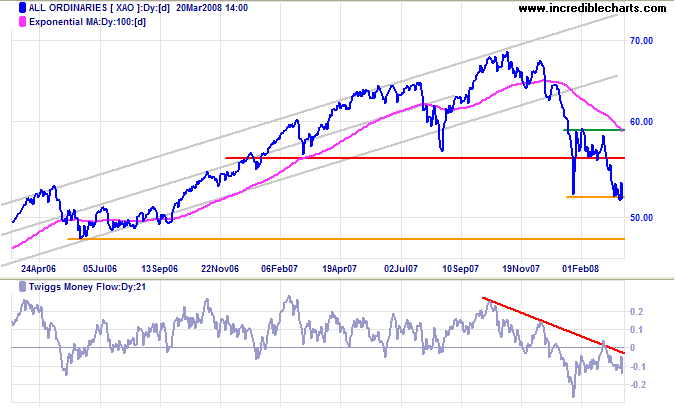
Long Term: Failure of short-term support at 5150 would
signal another down-swing with a calculated (medium-term)
target of 5200-(5900-5200)=4500. Expect support, however, at
the June 2006 low of 4800.
Twiggs Money Flow signals long-term selling pressure.
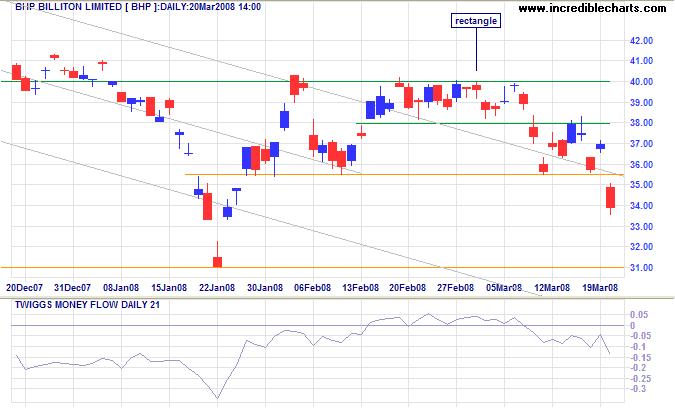
Mining giants BHP and Rio Tinto were hurt by the commodities sell-off. Expect BHP to test support at 31.00. Failure of this level would signal that the resources sector has joined the general market decline.
The desire for constant action irrespective of underlying
conditions is responsible for many losses on Wall Street even
among the professionals, who feel that they must take home some
money every day, as though they were working for regular
wages.
~ Jesse Livermore in Edwin Lefevre's
Reminiscences of a Stock Operator
To understand my approach, please read Technical Analysis & Predictions in About The Trading Diary.
