Hope Is Your Enemy
By Colin Twiggs
March 14, 11:00 p.m. ET (3:00 p.m. AET)
These extracts from my trading diary are for educational purposes and should not be interpreted as investment advice. Full terms and conditions can be found at Terms of Use.
USA
Hope is your biggest enemy in a bear market. When things go bad, it is human nature to hope that they will improve.
Hope springs eternal in the human breast...
~
Alexander Pope
Traders have to fight against this natural instinct. Instead, in a bear market, they need to fear that conditions will deteriorate.
Dow Jones Industrial Average
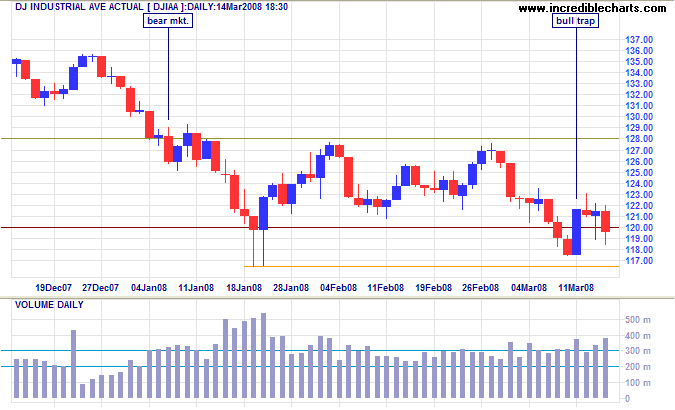
This week's bull trap on the Dow is a typical example. The
market reversed above the former support level of 12000 on news
that the Fed would inject $200 billion of additional liquidity
into the market. A further intra-day rally was sparked by
S&P, who had failed to anticipate the sub-prime crisis,
announcing that the worst is now over. Strong volume shows that
market heavyweights took the opportunity to reduce their
exposure, selling into the rally. Friday saw the trap snap
shut, after the Fed stepped in to save Bear Stearns from a
classic run on the investment bank (Globe
& Mail).
A long
candlestick tail on Friday signals the presence of buyers,
but they are likely to be over-whelmed by further selling.
Short-term support (at the January intra-day low of 11650) is
not expected to hold.
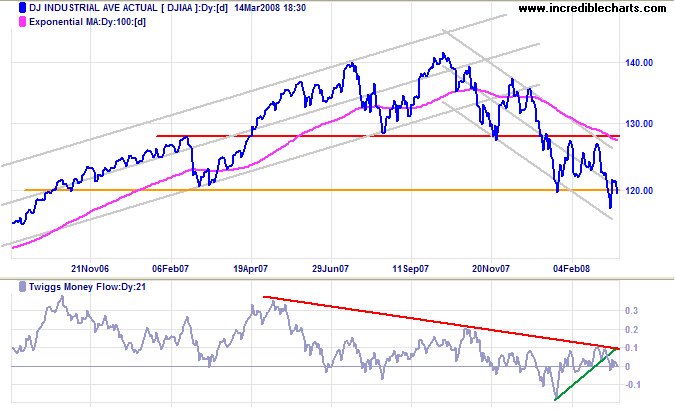
Long Term: The Dow retreated below support at 12000, signaling the start of another downward leg in the bear market. The medium-term target is 12000-(12800-12000)=11200. Twiggs Money Flow warns that short-term accumulation has ended while long-term selling pressure continues.
S&P 500
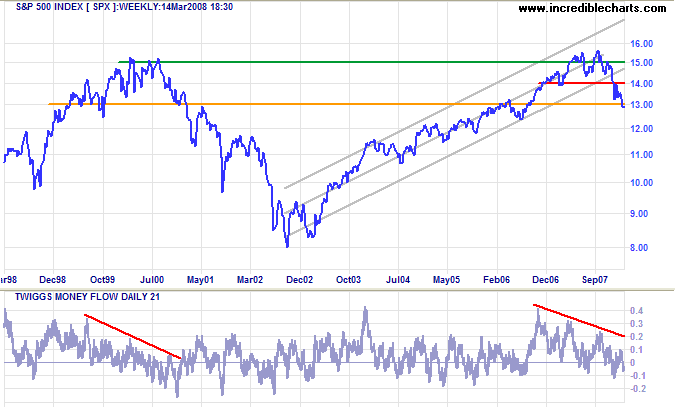
The S&P 500 confirms the Dow signal, reversing below support at 1300. The medium-term target is 1300-(1400-1300)=1200. Twiggs Money Flow signals continued long-term selling pressure.
Small Caps
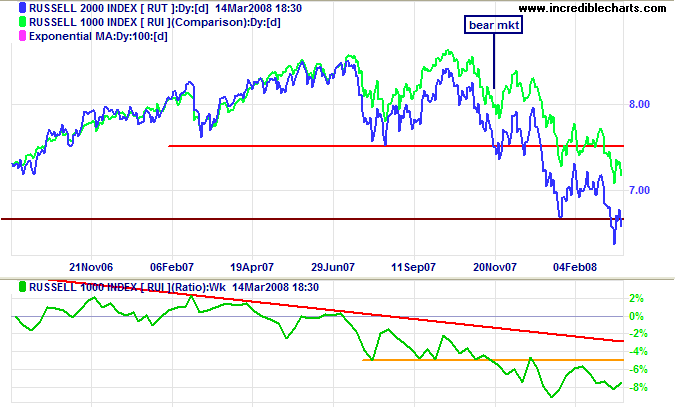
The Russell 2000 reversed below support at 670/650, warning of another down-swing with a target of 650-(750-650)=550. The falling ratio against the Russell 1000 highlights continuing migration to (relatively) safer large cap stocks.
Technology
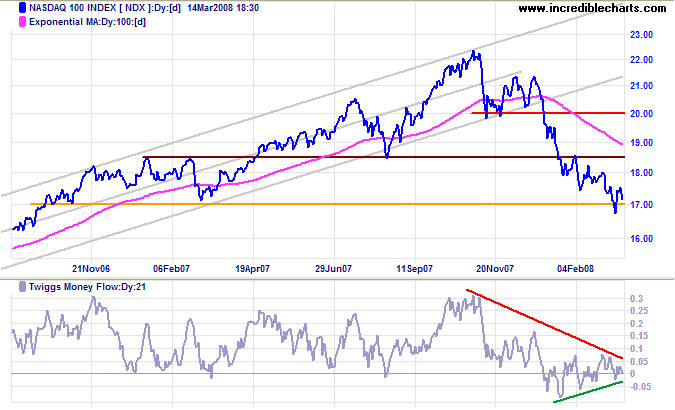
Technology stocks have faired better than the general market, with the Nasdaq 100 holding above support at 1700. Breakout would signal that the index has joined the broad primary down-swing. The target would be the July 2006 low of 1450. Twiggs Money Flow whipsawing around zero indicates uncertainty.
Transport
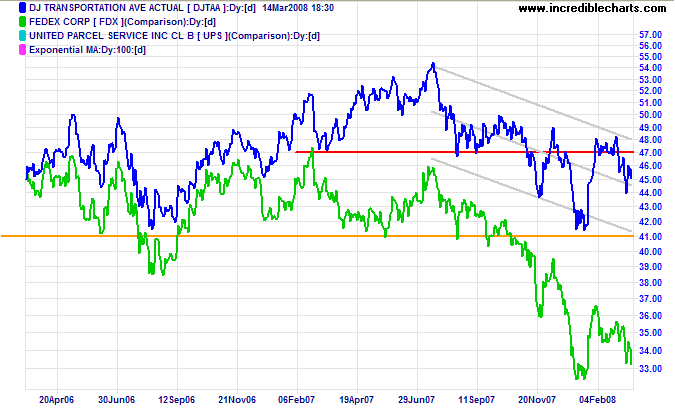
The Dow Jones Transportation Average and lead indicator Fedex continue in primary down-trends, with the average headed for another test of support at 4100.
United Kingdom: FTSE
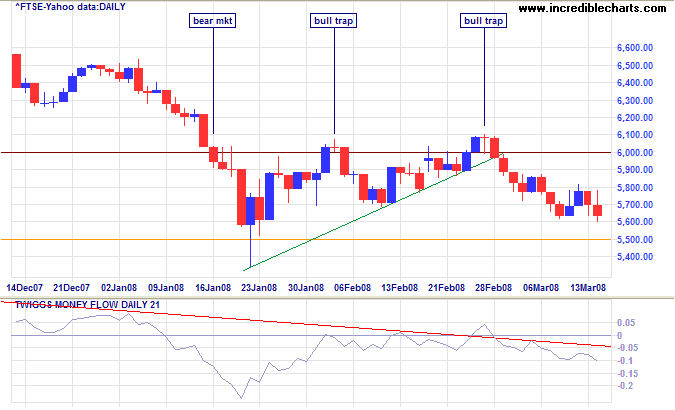
The FTSE 100 is headed for a test of support at 5500. Twiggs Money Flow holding below zero signals strong (long- and short-term) selling pressure. Failure of support would offer a (medium-term) target of 5500-(6000-5500)=5000.
India: Sensex
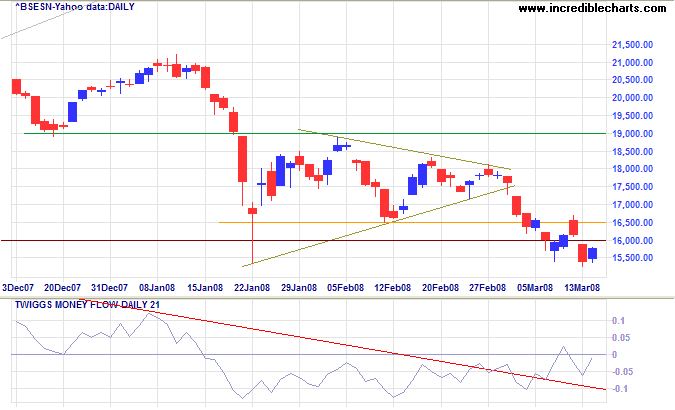
The Sensex pulled back to confirm the new resistance level at 16500, before resuming its downward trend — towards a target of 16500-(19000-16500)=14000, the August 2007 low. Twiggs Money Flow holding below the zero line warns of strong (short- and long-term) selling pressure.
Japan: Nikkei
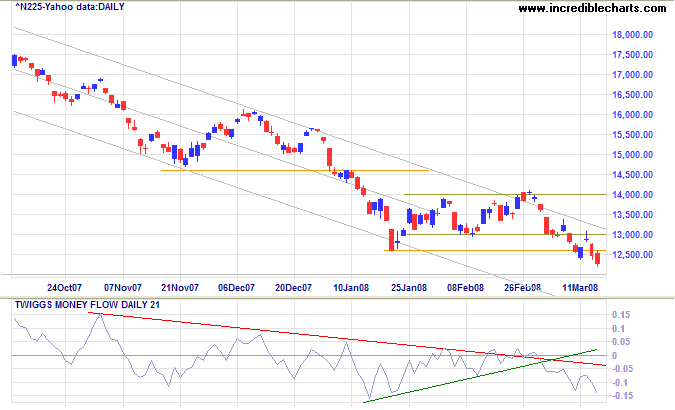
The Nikkei 225 tested the new resistance level at 13000
before continuing its primary down-trend. Expect support at the
original (2005) breakout level of 12000, but the calculated
target is lower — at 12600-(14600-12600)=10600, which
coincides with support in 2004 prior to the breakout.
Twiggs Money Flow signals strong selling pressure.
China: Hang Seng & Shanghai
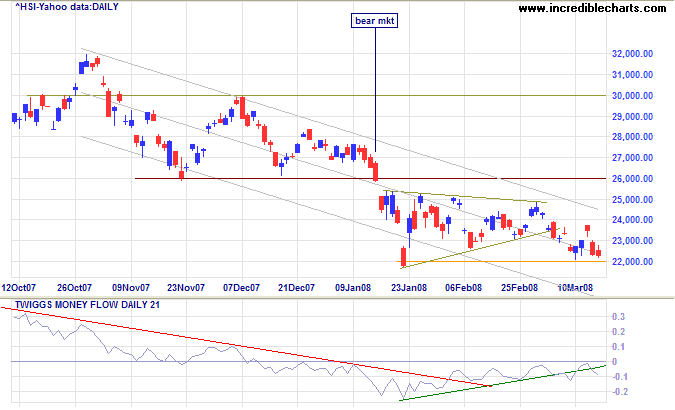
The Hang Seng broke downwards from the triangular consolidation and is testing support at 22000 — which is unlikely to hold. The next major support level is the August 2007 low of 20000, but the calculated target is even lower at 22000-(26000-22000)=18000. Twiggs Money Flow (holding below zero) warns of continued selling pressure.
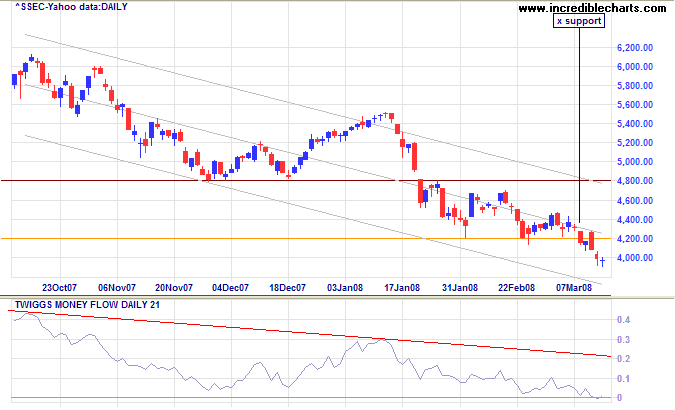
The Shanghai Composite broke through support at 4200, signaling another leg in the primary down-trend. The medium-term target is 3600 (from July 2007). The continued fall on Twiggs Money Flow warns of long-term selling pressure.
Australia: ASX
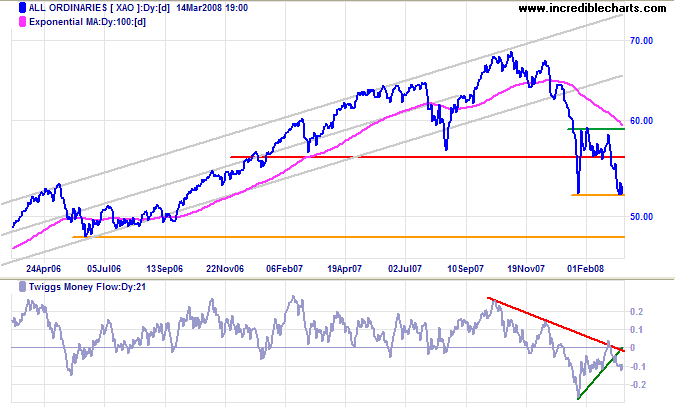
The All Ordinaries is consolidating above support at 5200. Declining volume confirms that the down-trend is likely to continue.
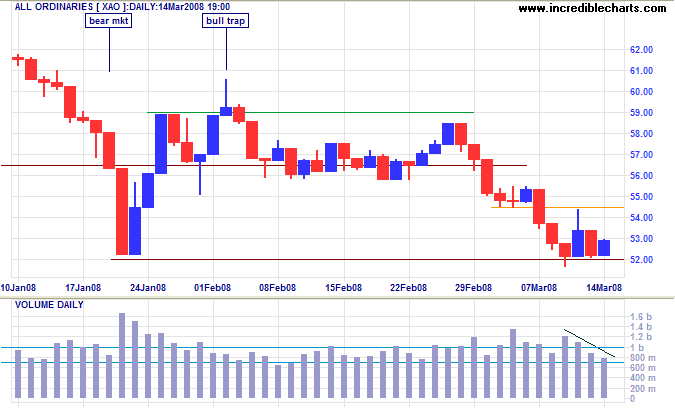
Long Term: An All Ords breakout below 5200 would confirm
another leg in the primary down-trend. Expect support at the
June 2006 low of 4800 — the calculated (medium-term)
target is 5200-(5900-5200)=4500.
Twiggs Money Flow respecting the zero line from below
signals long-term selling pressure.
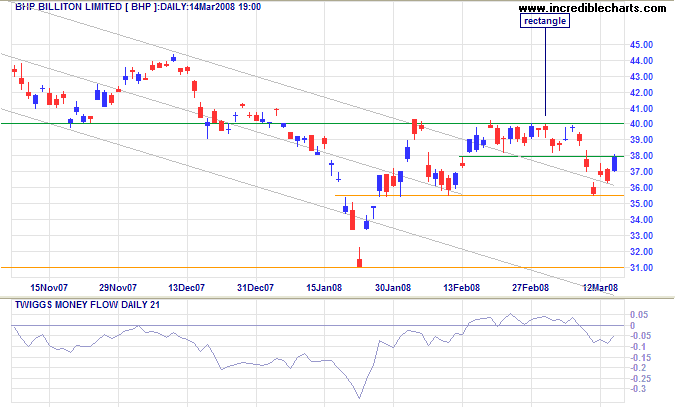
Last week I featured a bullish narrow rectangle on BHP. While the chart still has promise, downward breakout from the rectangle reminds us never to trade against the trend.
There is one side to the stock market; and it is not the bull
side or bear side, but the right side.
~ Jesse Livermore in Edwin Lefevre's Reminiscences of a Stock Operator
To understand my approach, please read Technical Analysis & Predictions in About The Trading Diary.
