Dow Tentative, China & India Rampage Ahead
By Colin Twiggs
October 13, 2007 3:00 a.m. ET (5:00 p.m. AET)
These extracts from my trading diary are for educational purposes and should not be interpreted as investment advice. Full terms and conditions can be found at Terms of Use.
USA
Declining housing investment and the subprime-induced credit squeeze are likely to dampen economic growth for the next 6 to 18 months. Further cuts in the federal funds rate may be required and the consequent fall in the dollar would increase the dollar price of imports (including crude oil, gold and commodities) while stimulating exports.
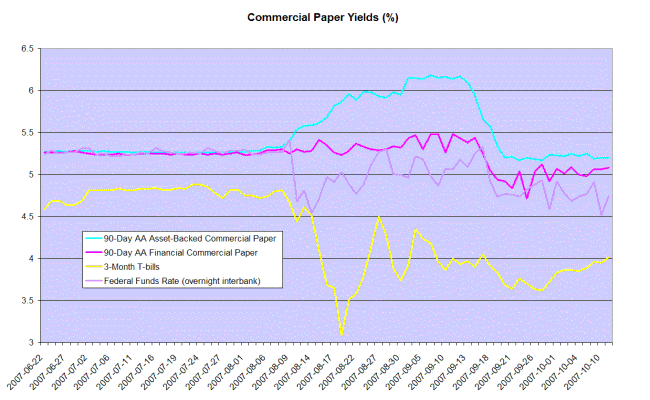
The wide spread between 3-month treasury bills and 90-day asset-backed commercial paper reflects continuing uncertainty in financial markets. I suspect that the party is over. The stock market may have sufficient momentum for one more rally, but earnings disappointments in finance, housing and consumer durables are likely through 2008 and may spill over into other sectors.
Dow Jones Industrial Average
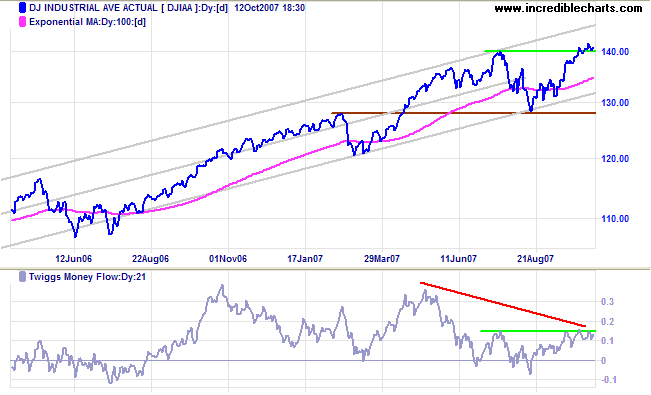
The Dow Jones Industrial Average is consolidating after a new all-time high above 14000. The target is 15000 [14000+(14000-13000)], but we need to remain vigilant.
Twiggs Money Flow signals medium-term accumulation, but long-term bearish divergence warns of distribution. A rise above the (light green) July high, however, would be a bullish sign.
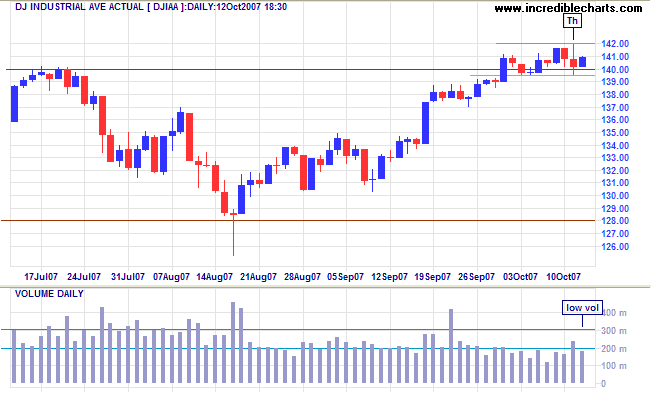
Short Term: Low volumes warn of buyers' hesitancy. The index is consolidating between 13950 and 14200 and a breakout would signal future direction.
Transport
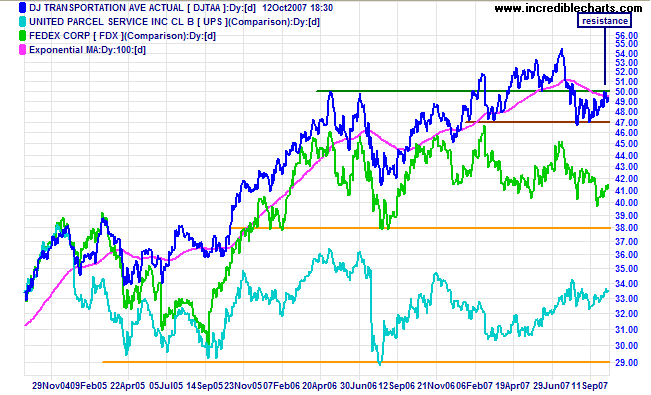
Dow Jones Transportation Average respected resistance at 5000. Narrow consolidation would be a bullish sign, while a retracement would test primary support at 4700. Fedex and UPS have been ranging since mid-2006, warning of bearish prospects for the economy.
Small Caps & Technology
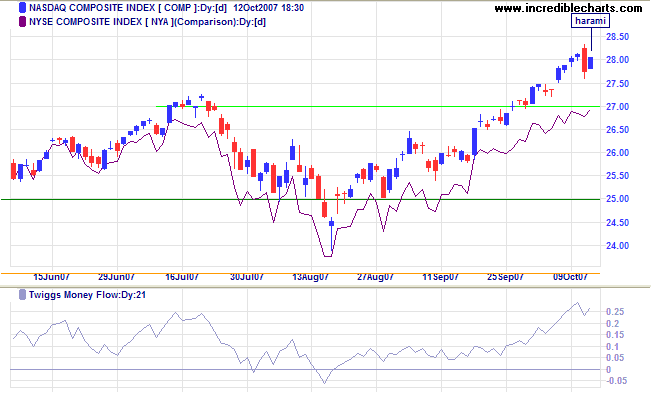
Technology stocks have been out-performing the broader market, with the Nasdaq Composite outstripping its NYSE counterpart while Twiggs Money Flow signals strong accumulation. Thursday's sharp drop has formed an harami candlestick pattern after Friday's inside day. A fall below Thursday's low would warn of a test of 2700, while a rise above the high would signal a further advance.
S&P 500
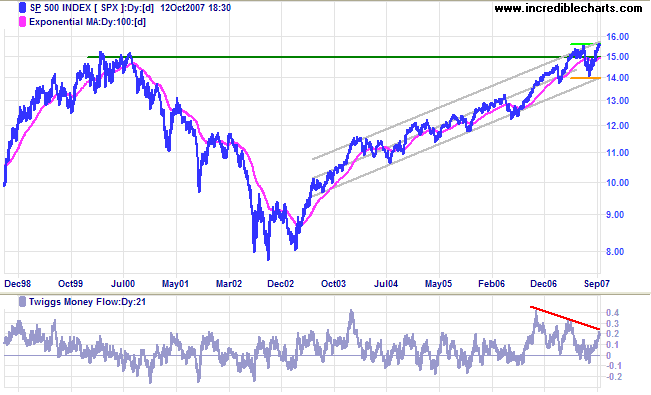
The S&P 500 has made a new all-time high, but bearish divergence on Twiggs Money Flow warns of long-term distribution. Retracement that respects support at 1500 would confirm a target of 1700 [1550+(1550-1400)], while a close below 1500 would warn of another correction.
United Kingdom: FTSE
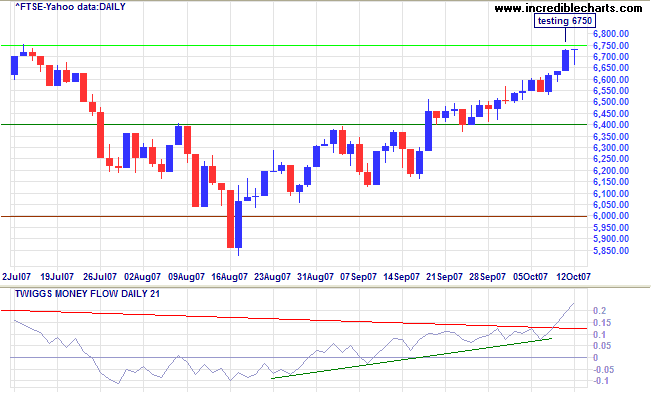
The FTSE 100 is testing resistance at 6750. Twiggs Money Flow signals strong (medium-term) accumulation and a breakout (above 6750) would test the all-time high of 6930. Respect of resistance, while not expected, would warn of a test of primary support at 6000/5850.
India: Sensex
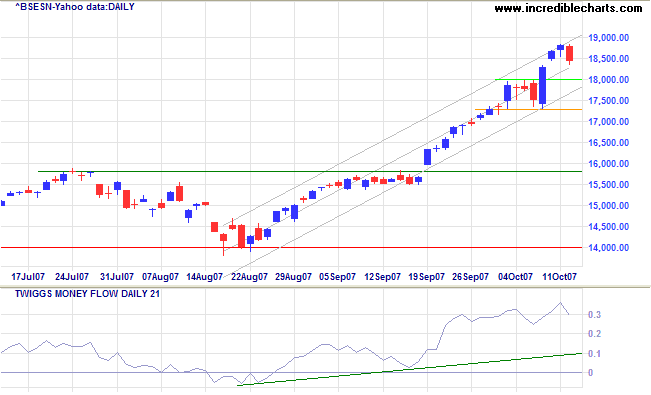
The Sensex respected resistance at 19000 after breaking out from its previous consolidation. A retracement that respects support at 18000 would signal another advance, with a target of 20000. Twiggs Money Flow signals strong medium-term accumulation. Primary support remains a long way below at 14000.
Japan: Nikkei
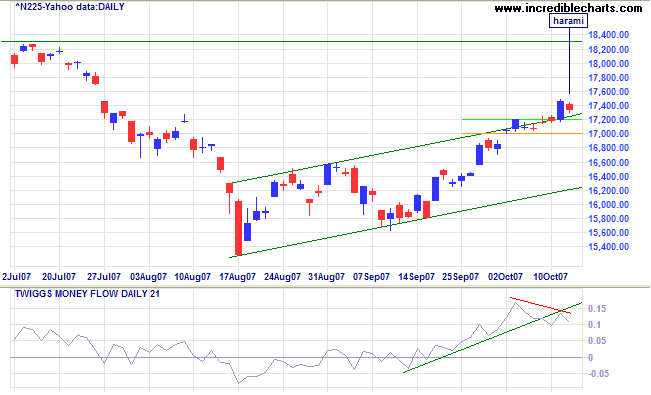
The Nikkei 225 formed an harami candlestick pattern after breaking out from narrow consolidation between 17000 and 17200. A rise above Thursday's high would signal a test of resistance at 18300, while a fall below 17200 would test the lower channel border (at 16300). Bearish divergence on Twiggs Money Flow signals short-term distribution and increased likelihood of a reversal.
China: Hang Seng & Shanghai
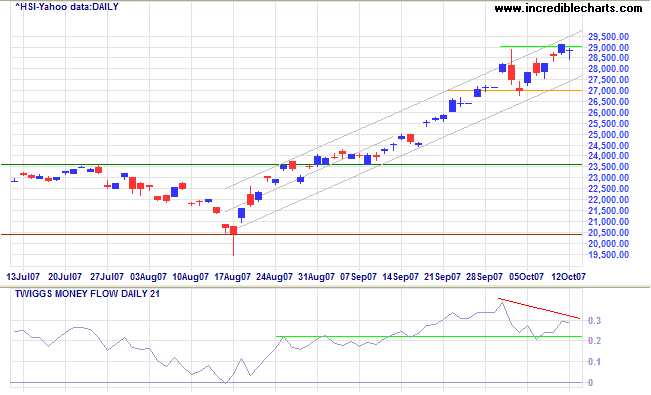
The Hang Seng is testing resistance at 29000. Twiggs Money Flow signals strong long and medium-term accumulation, but a short-term bearish divergence warns of another retracement to test the lower channel border. A fall below 27000 is not expected, but would warn of a secondary correction. The index is experiencing exceptional growth, having climbed a long way above primary support at 20500. Borrowing an analogy from the Fed: stocks in an up-trend may "climb like an escalator, but they correct like an elevator".
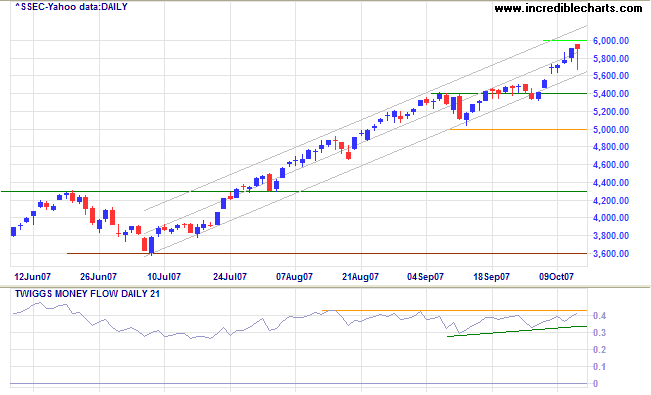
The Shanghai Stock Exchange is testing support at 6000, with a hanging man candlestick warning of another retracement. This is the final phase of a bull market: where prices are based on expectations rather than on actual achievements. Having climbed way above primary support at 3600, any correction could be severe.
Australia: ASX
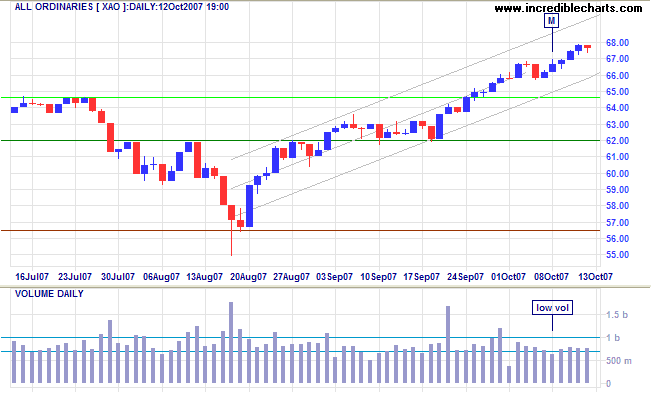
The All Ordinaries is more bullish than the Dow and FTSE 100, with Twiggs Money Flow, breaking above 0.2 to signal strong (medium-term) accumulation. The target is 7300 [6500+(6500-5700)].
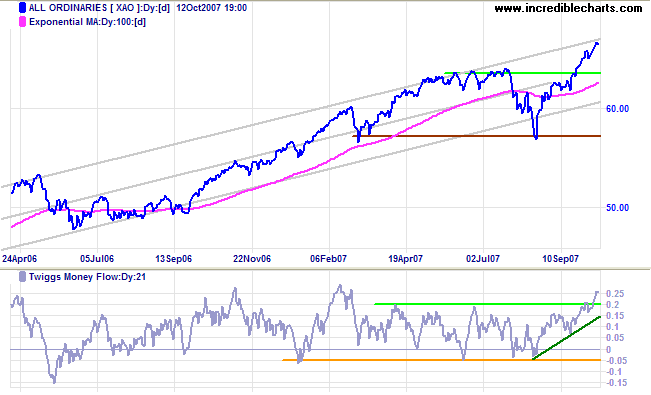
Short Term: Low volumes warn of increased uncertainty and tend to occur as an advance nears its end. In this case low volumes may signify nervousness about the global impact of declining growth in the US economy. Breakout above 6800 would signal another advance, while reversal below 6580, while not expected, would warn of a correction.
A fiat monetary system allows power and influence to fall into
the hands of those who control the creation of new money, and
to those who get to use the money or credit early in its
circulation. The insidious and eventual cost falls on
unidentified victims who are usually oblivious to the cause of
their plight. This system of legalized plunder (though not
constitutional) allows one group to benefit at the expense of
another. An actual transfer of wealth goes from the poor and
the middle class to those in privileged financial
positions.
~ Congressman Ron Paul (R-TX), Paper
Money and Tyranny
To understand my approach, please read Technical Analysis & Predictions in About The Trading Diary.
