Fed Keeps The Market Afloat
By Colin Twiggs
August 25, 2007 4:30 a.m. EST (6:30 p.m. AEST)
These extracts from my trading diary are for educational purposes and should not be interpreted as investment advice. Full terms and conditions can be found at Terms of Use.
USA: Dow, Nasdaq and S&P500
The effective federal funds rate remains at 4.88% (Thursday), well below the target rate of 5.25% (the fed funds rate is the rate at which banks lend overnight to each other), indicating that the Fed continues to provide liquidity. The sub-prime crisis is not yet over, with the level of adjustable rate mortgages reaching their reset date (the end of their low rate honeymoon) expected to peak at $50 billion in October, according to Credit Suisse. The monthly total will then continue at above $30 billion until September next year.
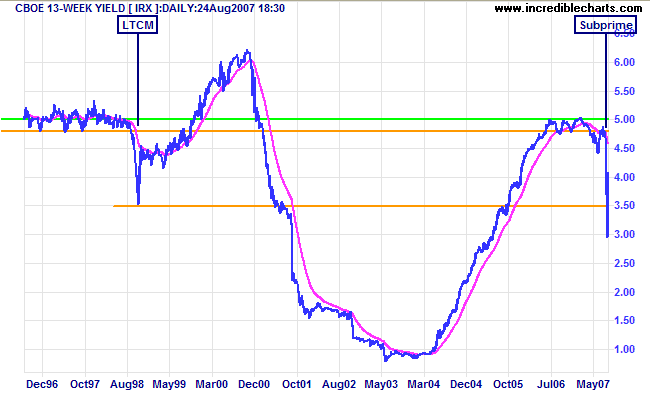
The yield on 13-week treasury bills reflects investors flight
to safety, with a fall of almost 1.50% (before recovering to
above 4.0%). A similar fall occurred in September 1998, when
Long Term Capital Management (LTCM) collapsed. The difference
is that the rescue package in 1998 was $3.5 billion - compared
to the more than $1 trillion of sub-prime mortgages due to be
reset over 2007/2008. The impact will be far-reaching, with the
banking sector demanding a much higher premium for risk over
the next few years.
The Dow Jones Industrial Average respected the lower
border of the trend channel at 12800 before rising through the
first line of resistance at 13200. Together with
Twiggs Money Flow breaking its downward trendline, this
indicates that the down-trend of the last few weeks is
weakening - but not necessarily ended.
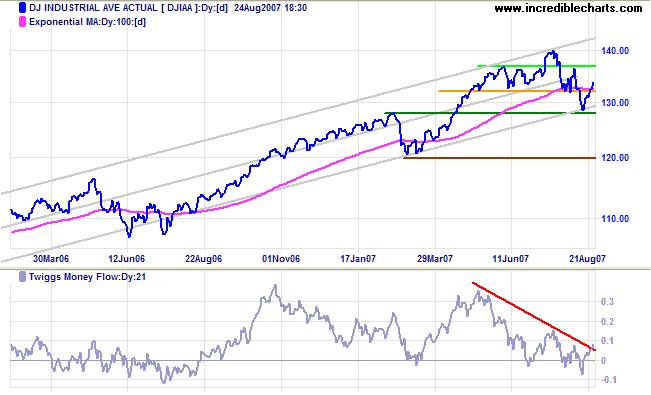
Long Term: The primary trend remains up.
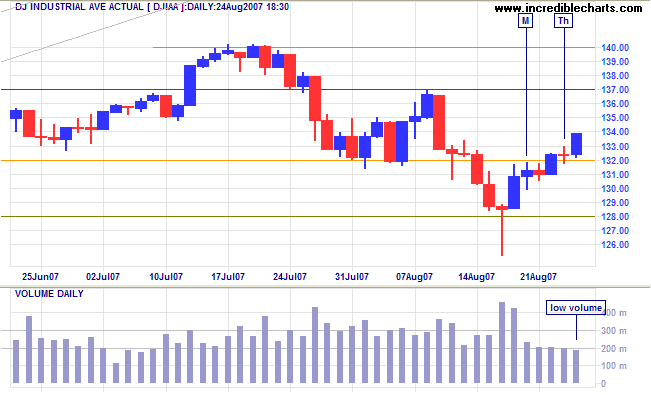
Short Term: A rise above 13700 would signal that the correction has ended, while reversal below 13200 would warn of another down-swing. Low volume signals a lack of enthusiasm for the latest rally, but this could turn bullish if low volume continues into the next down-swing.
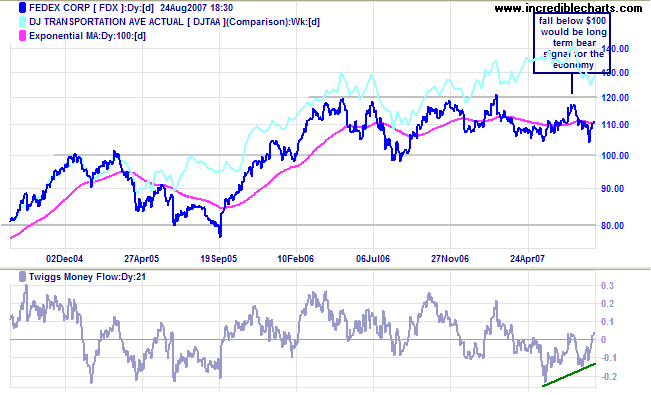
Fedex serves as a good barometer of overall economic activity. While the Dow Jones Transportation Average made new highs at the start of 2007, Fedex continued to range between $100 and $120. Bullish divergence on Twiggs Money Flow indicates that a test of resistance at 120 is now likely, but only a breakout from the (100 - 120) range would signal long-term direction.
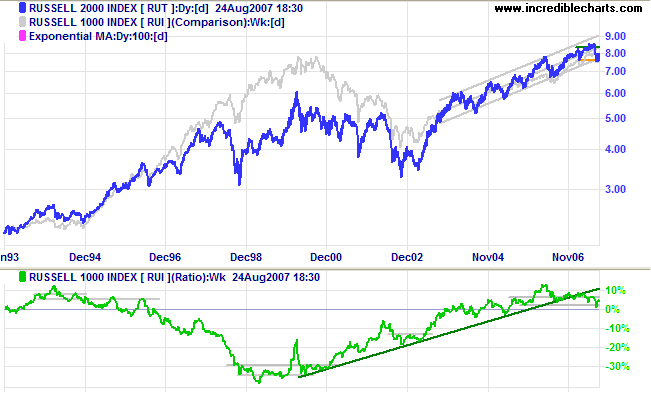
The Russell 2000 small caps index is approaching a watershed. Affected by the flight to safety, small caps are declining faster than the large cap Russell 1000 index. The Price Ratio (Russell 2000/1000) has leveled off and the break of the rising trendline warns of a long-term shift towards lower-risk, large cap stocks.
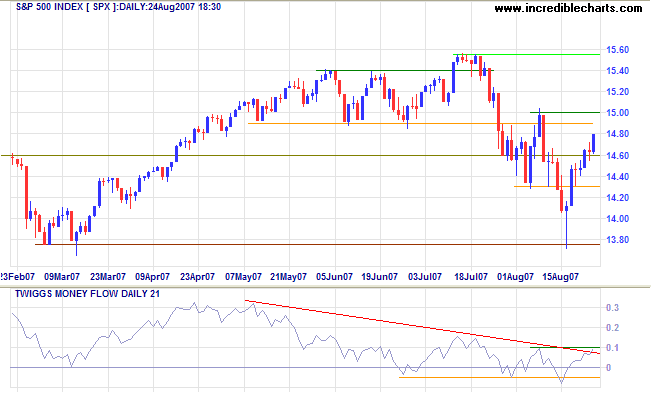
The S&P 500 is headed for a test of resistance at
1500 - a rise above this level would signal that the correction
has ended. Twiggs Money Flow's rise above the falling trendline
signals that the recent down-trend is weakening. The correction
has not yet ended, however, and respect of 1500 remains equally
likely (look out for reversal below 1460), warning of another
test of primary support.
Long Term: The primary trend remains up.
LSE: United Kingdom
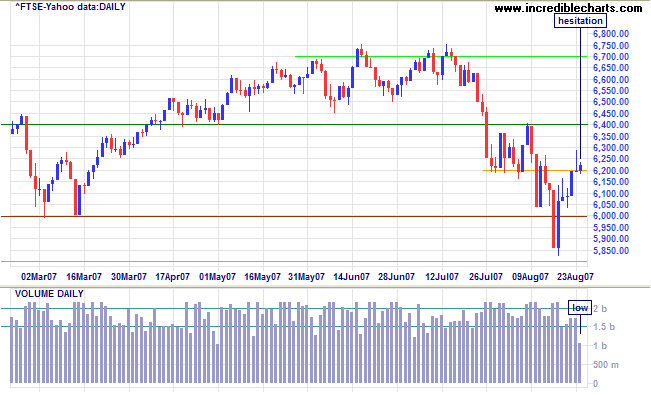
The FTSE 100 recovered to the first line of resistance
at 6200, but Thursday's weak close and Friday's unusually low
volume signal indecision. A close below 6200 would warn of
another test of primary support at 6000; while a rise above
6400 would indicate that the correction is over - and the fall
through primary support was merely a false break. Twiggs Money
Flow remains bearish (below zero).
Long Term: (Repeated from last week) We have a signal
that the primary trend has reversed, but I would wait for
confirmation. The signal is weak because:
- this is a large correction, rather than a lower high followed by a new low;
- the price earnings ratio is low at 14;
- the index immediately retreated above the former support level.
India: Sensex
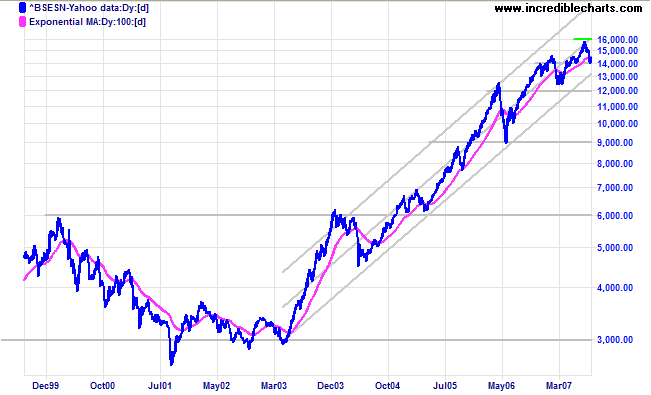
The Sensex is testing support at 14000 after a secondary correction from the peak at 16000. The index remains well within its strong upward trend channel and respect of 14000 would confirm trend strength.
Japan: Nikkei
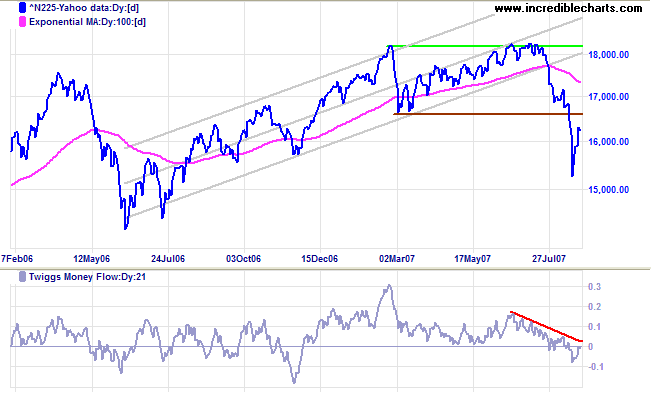
The Nikkei 225 is retracing to test the new resistance level at 16600. Respect would confirm the primary down-trend. Twiggs Money Flow signals distribution and a peak that respects zero (from below) would strengthen the signal.
China: Hang Seng & Shanghai
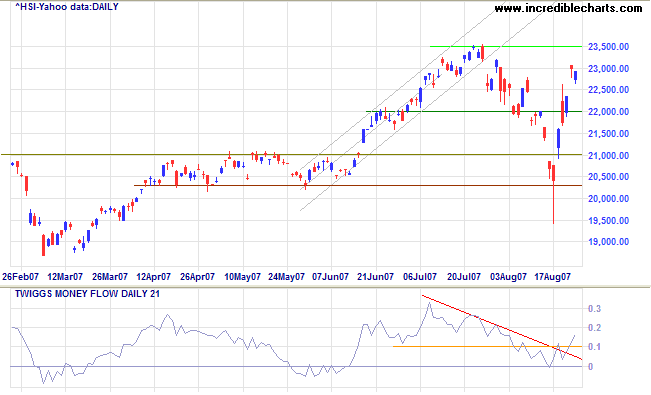
The Hang Seng is testing resistance at 23000 after a sharp rally, with Twiggs Money Flow breaking through its falling trendline to signal accumulation. A close above 23500 would signal another primary advance, with a target of 26700 [23500+(23500-20300)], but respect of resistance remains equally likely. The primary trend is up, with support at 18600.
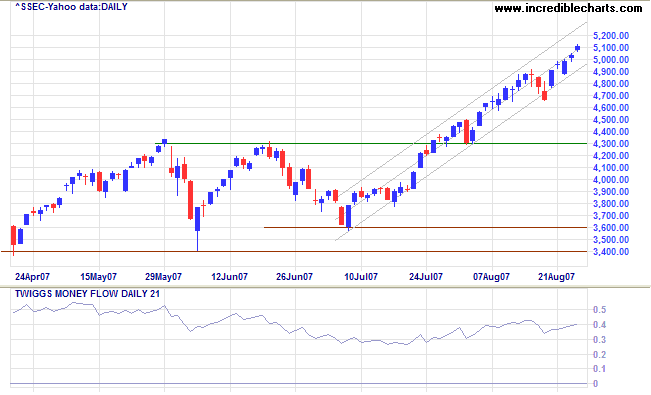
The Shanghai Composite reached its target of 5000 [4300+(4300-3600)]. Twiggs Money Flow signals strong accumulation. The advance may well continue further, but a downward break from the trend channel would warn of a secondary correction. The price earnings ratio is high, at 26, signaling that the bull market has entered stage 3.
ASX: Australia
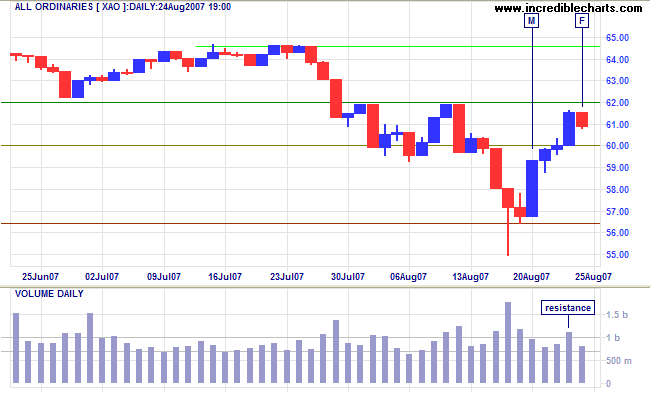
The All Ordinaries rallied steeply after testing primary
support at 5650; but sharp rallies in a bear trend cannot be
trusted and
Twiggs Money Flow (21-day) signals uncertainty.
Long Term: The primary trend remains up. I believe that
the bull market has entered stage 3 despite the modest price
earnings ratio.
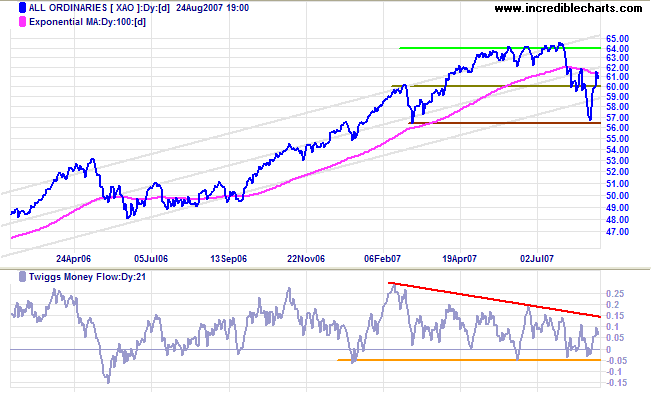
Short Term: Expect further hesitation, accompanied by low volume, below resistance at 6200. A close above 6200 would signal that the correction is over, while a fall below 6000 would warn of another test of primary support at 5650.
The financial markets generally are unpredictable. So that one
has to have different scenarios. The idea that you can actually
predict what's going to happen contradicts my way of looking at
the market.
~
George Soros
To understand my approach, please read Technical Analysis & Predictions in About The Trading Diary.
