Gold, Oil, Currencies & Interest Rates
By Colin Twiggs
April 24, 2007 11:00 p.m. ET (1:00 p.m. AET)
These extracts from my trading diary are for educational purposes and should not be interpreted as investment advice. Full terms and conditions can be found at Terms of Use.
Gold
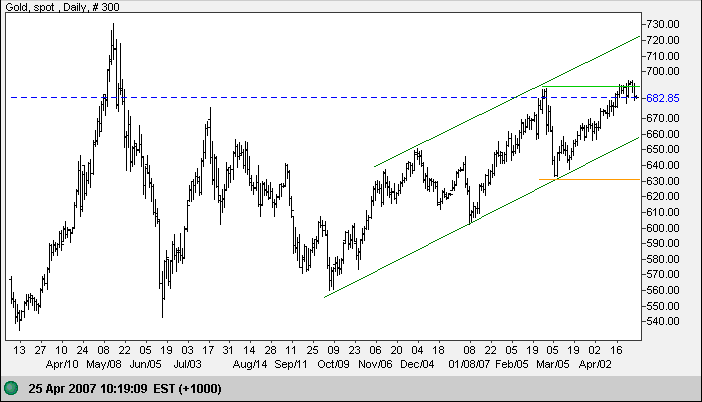
Spot gold encountered resistance at the previous high of $690.
Narrow consolidation or a short retracement would be a bullish
sign -- that the rally is likely to test the upper border of
the channel. A fall below support at $630 remains unlikely,
signaling reversal of the up-trend.
Weaker crude prices ease demand for gold.
Source: Netdania
Crude Oil
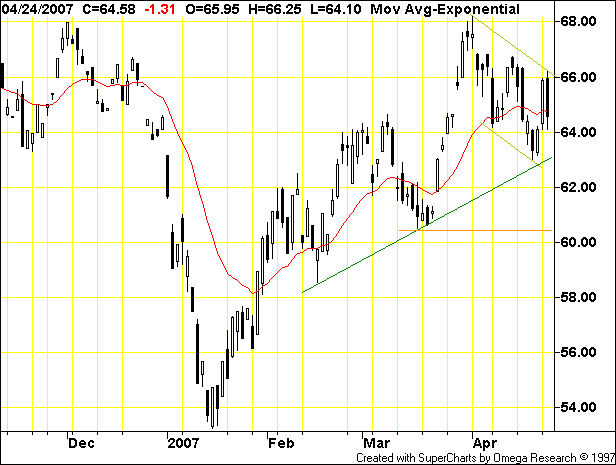
June Light Crude is edging lower in the shape of a large flag, favoring continuation of the up-trend. A higher low above $63 would be bullish -- confirmed if followed by an upward breakout above $66. A fall below $63, on the other hand, would break the upward trendline, signaling weakness; and a fall below the March low would confirm that the trend has reversed.
Currencies
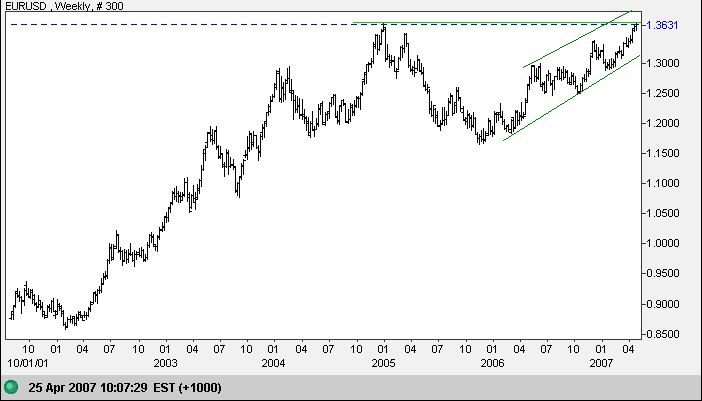
The euro is testing its 2005 high of $1.37. Breakout above this level would be a bullish sign for the euro, with a long-term target of $1.57 (1.37 + [ 1.37 - 1.17 ]). Narrow consolidation or a short retracement would be bullish, while reversal below $1.29, though unlikely, would signal that the up-trend has ended.
Source: Netdania
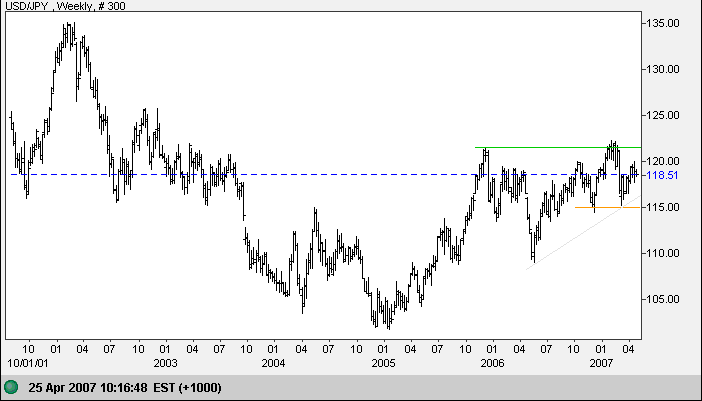
The dollar is edging slowly upwards against the yen, with short-term resistance at 120. Breakout above 122 would be a long-term bull signal, while failure of support at 115 would warn of a large correction.
Source: Netdania
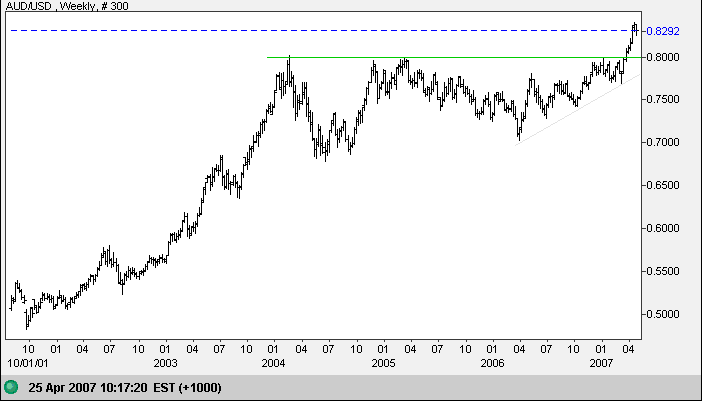
The Australian dollar is retracing to test support after the sharp breakout above the long-term ascending triangle. Respect of the new support level at 80 would be a strong bull signal.
Source: Netdania
Treasury Yields
Ten-year treasury yields have reversed and are consolidating above the long-term (green) trendline. Breakout from the triangle formation will signal future direction.
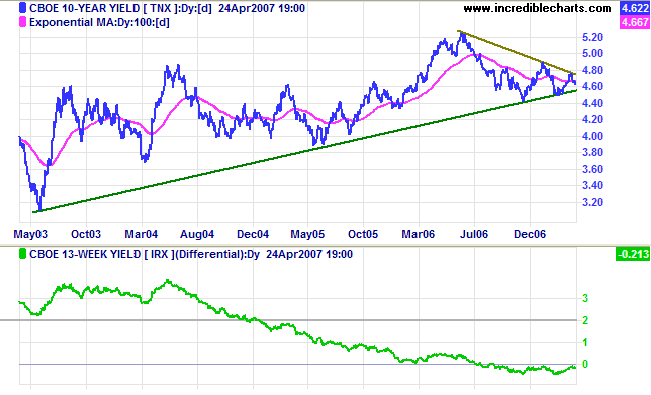
Short-term treasury yields are ranging in a narrow band between 4.80 and 5.00% while the yield differential (10-year minus 13-week treasury yields) remains negative. The negative yield curve is caused by low long-term yields rather than a sharp rise in short-term rates, reducing its significance. Suppression of long-term yields by large carry trades between the yen and higher yielding currencies has a destabilizing effect on the market. Though not expected any time soon, unwinding of these positions may leave the Fed and other central banks in a difficult position.
Dow Jones Industrial Average
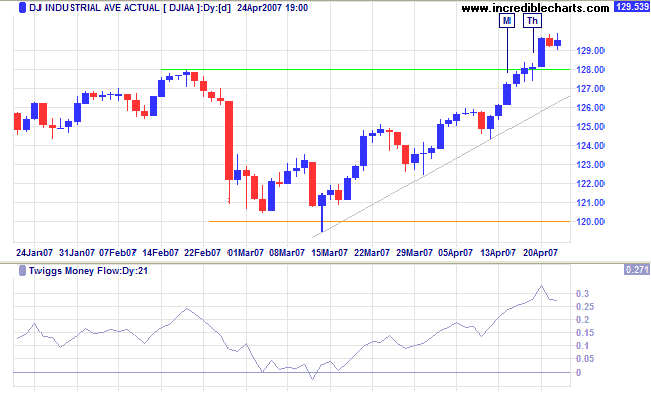
The Dow Jones Industrial Averagebroke through its February high of 12800 and is now consolidating below 13000. Narrow consolidation or a short retracement would be a bullish sign. Twiggs Money Flow signals both long- and short-term accumulation.
Wright Model
Probability of recession in the next four quarters decreased to 45 per cent according to the Wright Model.
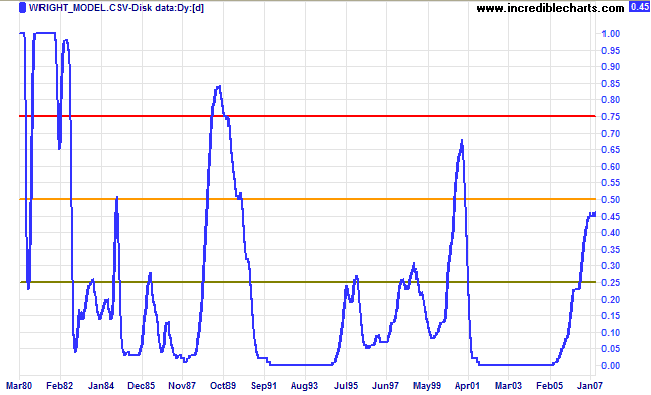
There is some evidence that the Wright model may understate probability of recession in a low interest rate environment (as at present).
They shall not grow old as we that are left grow old.
Age shall not weary them nor the years condemn.
At the going down of the sun and in the evening
we will remember them.
~ From the Anzac Day Service
To understand my approach, please read Technical Analysis & Predictions in About The Trading Diary.
