Confidence Improving
By Colin Twiggs
March 31, 2007 1.00 a.m. ET (5:00 p.m. AET)
These extracts from my trading diary are for educational purposes and should not be interpreted as investment advice. Full terms and conditions can be found at Terms of Use.
USA: Dow, Nasdaq and S&P500
The Dow Jones Industrial Average retraced to test support at the 100-day moving average. Respect of the moving average would signal a rally to the upper border of the trend channel (drawn at 2 standard deviations around a linear regression line), while a fall below 12000 would signal a secondary correction. Continued long-term bearish divergence on Twiggs Money Flow (21-day) warns us to exercise caution, but the short-term signal is positive.
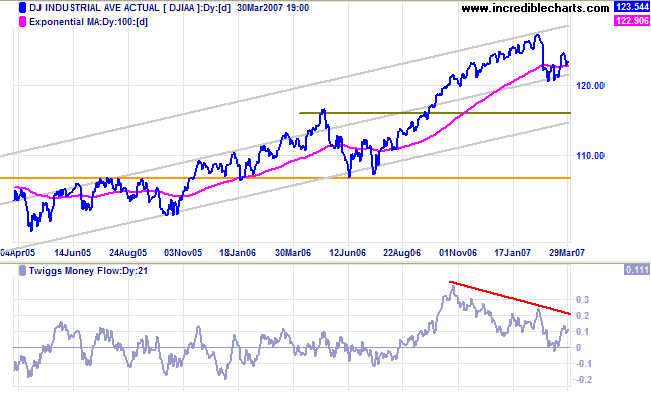
Long Term: The primary up-trend continues. Respect of the May 2006 peak of 11600 would indicate a healthy up-trend, while a fall below the June 2006 low of 10700 would signal reversal to a down-trend.
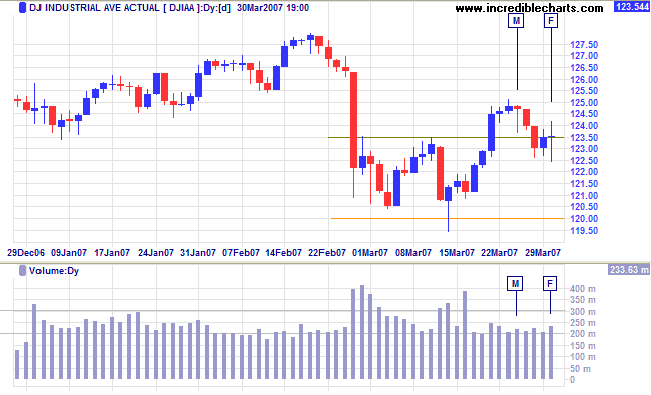
Short Term: The Dow broke through 12350 on Wednesday, but encountered support at 12300; support and resistance often migrate to the nearest round number. The long-legged doji candlestick on Friday warns of increased volatility. Recovery above 12400 would signal continuation of the rally, while a close below 12300 would warn of another test of 12000.
The Dow Jones Transportation Average respected resistance at 5000 and is now headed for a test of support at 4700. A fall below this level would be bearish, signaling a test of 4500 and possibly primary support at 4100. Consolidation between 4700 and 5000, on the other hand, would be bullish. The transport index is now approaching a watershed.
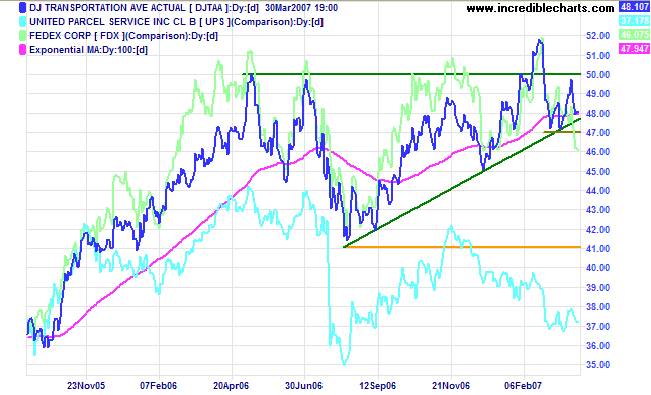
Fedex and UPS are weakening. A fall below their December 2006 lows would signal that economic activity is slowing.
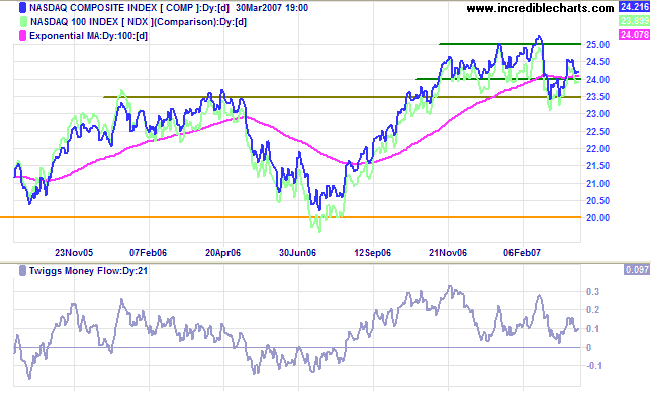
The Nasdaq Composite is testing support at 2400. Respect
of this level would mean a rally to 2500. Breakout above 2500
would be bullish for all equity markets, while a break below
2350 would warn of a test of 2000.
Long Term: The primary trend is up, with support at
2000.
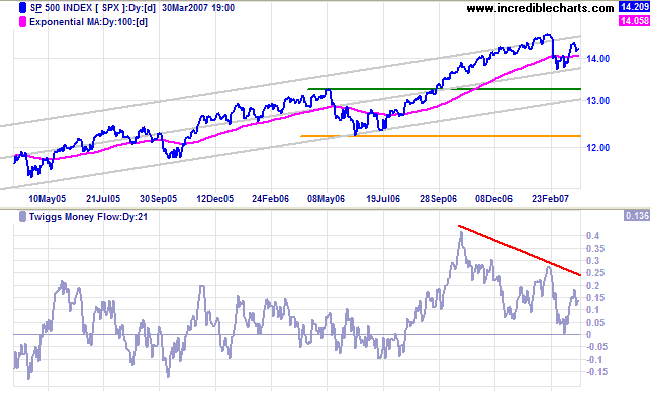
The S&P 500 is headed for a test of the upper border
of the trend channel (drawn at 2 standard deviations around a
linear regression line), but the long-term divergence on
Twiggs Money Flow (21-day) warns of distribution.
Long Term: The primary trend is up, with support levels
at 1325 and 1220.
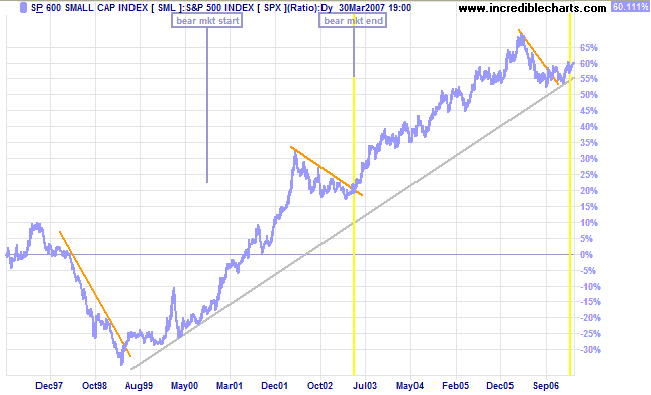
The chart below depicts the relative strength of the S&P (Small-Cap) 600 against the S&P 500. We can see that small caps stocks are in a long-term up-trend against large caps, and there are only 3 times in the last 10 years when the market has sought the safety of large caps:
- the sharp correction in 1998;
- the final phase of the 2002/2003 bear market; and
- the May to September correction in 2006.
Confidence is now recovering.
LSE: United Kingdom
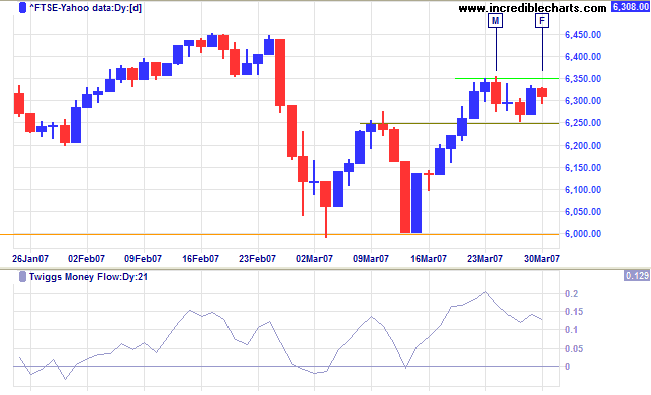
The FTSE 100 is consolidating between 6250 and 6350: a
bullish sign. A rise above 6350 would complete the continuation
pattern, while a fall below 6250 would warn of a test of 6000.
Twiggs Money Flow (21-day) is holding above zero, signaling
accumulation. Breakout above 6450 would give a target of 6900 (
6450 + [6450 - 6000] ). A fall below 6000 is now unlikely, but
would signal a test of primary support at 5500.
Long Term: The primary up-trend continues.
Nikkei: Japan
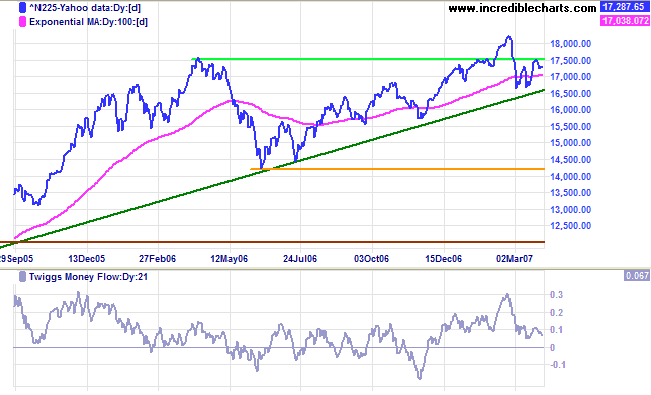
The Nikkei 225 is testing resistance at 17500/17600.
Narrow consolidation below the resistance level would be a
strong bullish sign. Breakout would signal a target of 21000 [
17600 + ( 17600 - 14200 )].
Twiggs Money Flow (21-day) shows short-term weakness, but
is holding well above zero.
Long Term: The primary trend remains up, with support at
the June 2006 low of 14200.
ASX: Australia
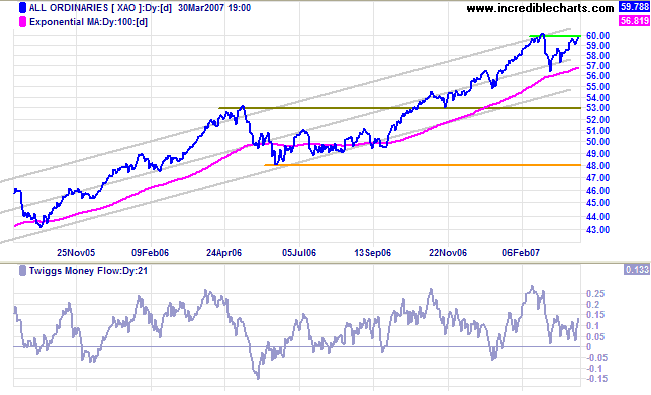
The All Ordinaries is testing resistance at 6000. As one
reader aptly put it: "After the sharp correction, the insiders
can smell your fear". Narrow consolidation below the resistance
level would be a strong bull signal; and a close above the
February high would end the correction. We may be in for some
fun and games first, however, with insiders attempting to flush
out any weak hands. Breakout above 6000 would have a target of
6350 ( 6000 + [6000 - 5650] ).
Twiggs Money Flow (21-day) is holding above zero, signaling
accumulation. Reversal below 5650, though unlikely, would
present a strong bear signal.
Long Term: The primary up-trend continues. The first
line of support is the May 2006 high of 5300, while a fall
below the June 2006 low of 4800 would signal reversal to a
down-trend.
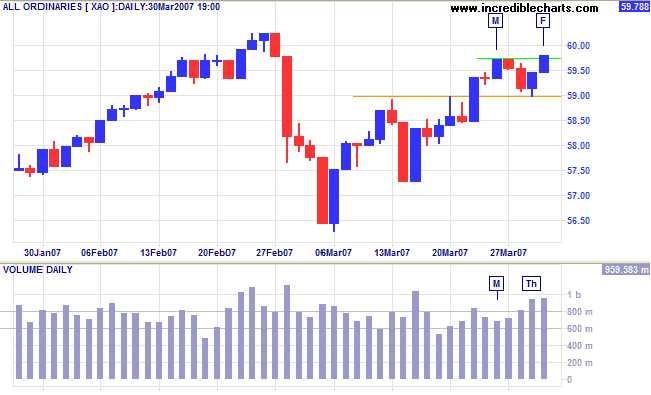
Short Term: The index respected resistance at 5900, with Thursday's strong volume indicating support. Friday's breakout above the high of [M] is a positive sign, but large volume warns of significant resistance: expect profit-taking in the week ahead. A fall below 5900 would warn of a test of 5650.
Treat people as if they are what they ought to be and you will
help them become what they are capable of becoming.
~ Johann Wolfgang von Goethe (1749 - 1832)
To understand my approach to technical analysis, please read Technical Analysis & Predictions in About The Trading Diary.
