2007: The Big Picture
By Colin Twiggs
January 10, 2007 2:00 a.m. ET (6:00 p.m. AEDT)
These extracts from my daily trading diary are for educational purposes and should not be interpreted as investment advice. Full terms and conditions can be found at Terms of Use. This is my first newsletter for 2007 and I wish you peace and prosperity in the year ahead.
The Big Picture
Whenever there has been a significant rise in short-term interest rates in the last 45 years, a recession* has followed within 12 to 18 months -- except where long-term rates have shown a corresponding rise, to maintain a positive yield curve.
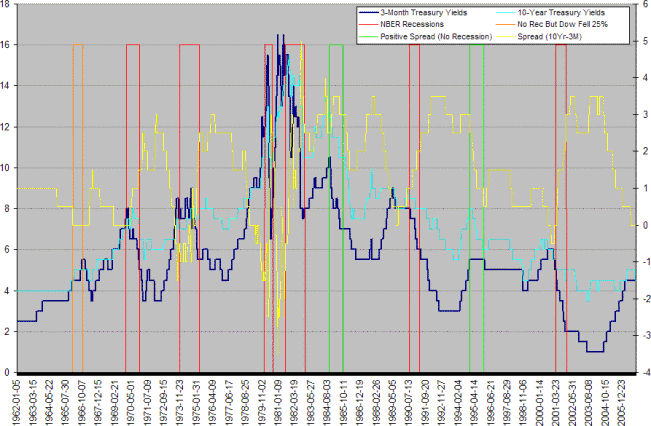
*1966 is not recognized as a recession by the NBER, but the Dow fell by 25%.
A flat or negative yield curve destroys bank profit margins: they borrow short and lend long, pocketing the interest rate spread. When margins narrow banks stop lending money; investment in real estate and the stock market slows; and asset prices fall. Lower asset prices mean more loan defaults for the banking sector, precipitating further tightening of lending practices and starting the downward spiral into a recession.
Increased use of variable-rate loans in recent years may protect bank margins to some extent, but large banks are still experiencing compressed net interest margins (see FDIC: Fall 2006).
An FDIC paper by Nathan Powell in early 2006 highlighted banks' reduced reliance on lending margins, with enhanced fee income. However, increased fee income from other sources does not make lending at narrow margins any more attractive than it was before. Banks are bound to restrict lending when their margins are squeezed.
The Asset Bubble
When the Fed pumps new money into the market to stimulate the economy, the market (as a whole) is savvy enough to borrow as much as it can and invest in real assets that will appreciate with inflation. The result is that demand exceeds supply, driving asset prices higher -- and investment yields lower. We have witnessed an asset bubble over the last 5 years, with massive rises in real estate prices and the dividend yield on the Dow Jones Industrial Average at a historically low 2 per cent (compared to the normal range of between 3% and 6% from 1925 to 1990).
At some point the market has to correct. Rising interest rates increase the carrying cost of investments, while lower investment yields result in larger shortfalls. Higher rates also reduce inflation which means no more asset appreciation -- the only remaining incentive to use debt to finance investments.
So Where Are we Now?
- We have witnessed a significant rise in short-term rates over the last 3 years -- the Fed is mopping up excess liquidity after flooding the market with money to stimulate a recovery in 2001.
- The spread between 10-Year and 3-Month Treasuries has been below zero since August last year.
- The housing market is falling.
Will Equity Markets Follow?
There is no indication as yet that the current bearish divergence on Twiggs Money Flow warns of anything more than a secondary correction for the Dow Industrial Average.
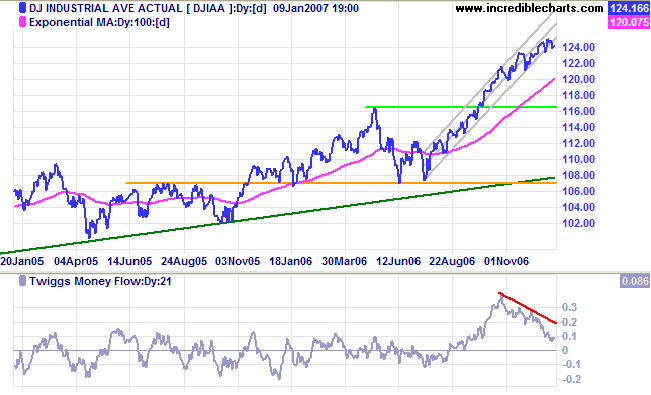
It is likely, however, that we will witness a market down-turn in the next 12 months. We will need to remain vigilant throughout 2007 -- particularly in October, the start of several previous down-turns.
Will The Fed Lower Interest Rates?
In my view this will only occur if there is a sharp down-turn. A reduction in the fed funds rate, far from being a positive sign, will indicate Fed acknowledgement that the economy is in trouble.
Core CPI may seem relatively stable, but this is not a true measure of overall inflation. The loss in purchasing power of the dollar is far greater when one considers the asset bubble (and higher energy prices). Higher asset prices eventually flow through to the consumer price index in the form of higher rents and prices, but the impact may be lagged by several years. The Fed will be aware of this and is unlikely to take its foot of the brake unless forced to.
Gold
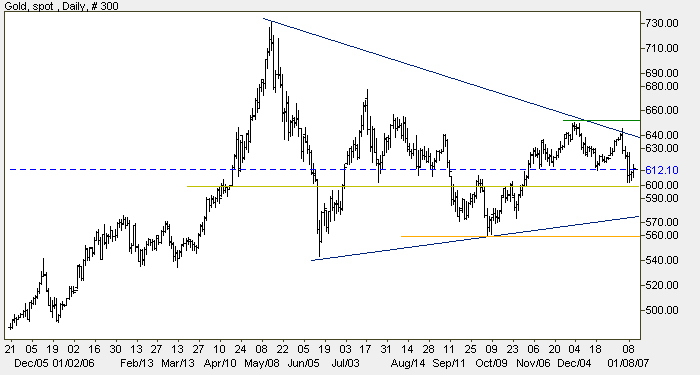
Spot gold broke through intermediate support at $615, but
respected $600. A fall below this level would signal a test of
primary support at $560. $600 is also the mid-point of a large
triangular consolidation which started with the high of May
2006. A break below primary support at $560 would warn of a
primary down-trend, while a rise above $650 would signal
resumption of the primary up-trend.
If crude oil prices fall below $55 this would reduce demand for
gold, while a weaker dollar would increase demand; two opposing
forces that may to some extent offset each other.
Source: Netdania
Crude Oil
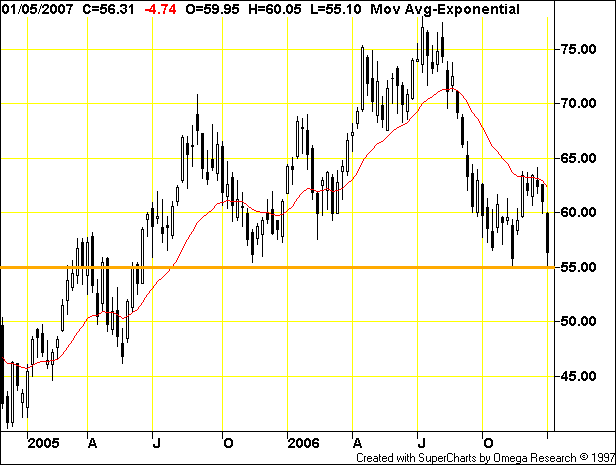
Crude is testing support at $55/barrel. Prospects of a mild winter (global warming?) and a slowing economy have eased demand. Failure of support would warn of a long-term down-trend. Consolidation above this level, however, would establish a base for continuation of the long-term up-trend.
Currencies
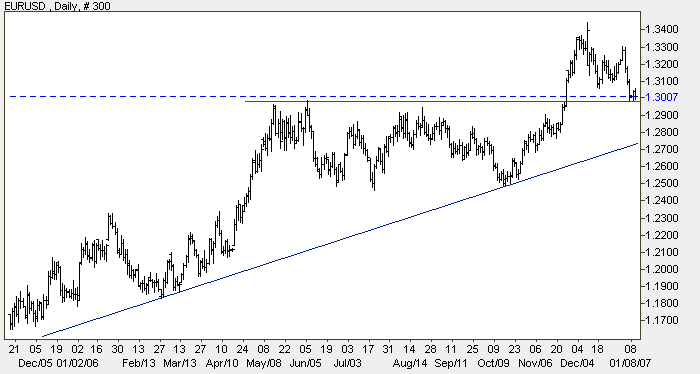
The euro pulled back to test the new support level at $1.30. Respect of this level would be a strong bull signal (bearish for the dollar), signaling continuation of the long-term up-trend.
Source: Netdania
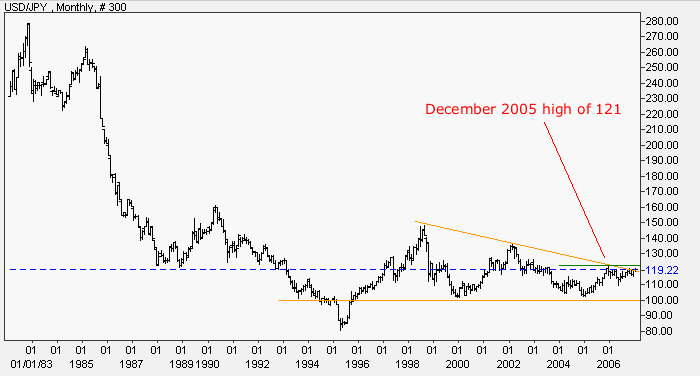
The dollar is in a long-term bearish descending triangle against the yen, with support at 100. The greenback has lately rallied and appears headed for a test of resistance at the December 2005 high of 121. A breakout above this level would be a strong bull signal for the dollar. Respect of resistance, on the other hand, would signal a test of long-term support at 100, raising fears of a fall below 100 and continuation of the long-term down-trend.
Source: Netdania
Wright Model
Probability of recession in the next four quarters continues to creep upwards according to the Wright Model reaching 45 per cent at the end of last year.
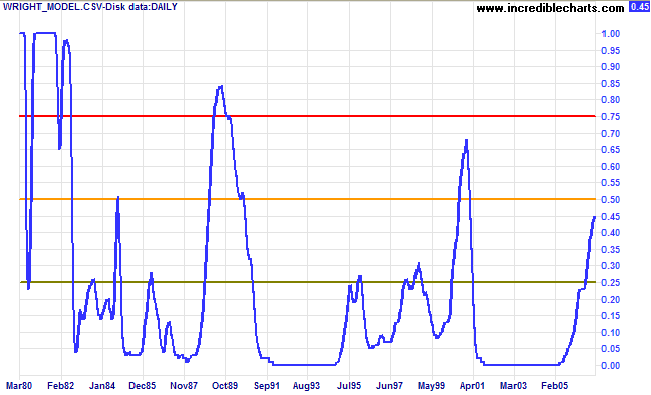
I have been corresponding with Klaus Singer who runs Time Pattern Analysis, a German website focused on modelling the economic cycle and predicting recessions. He points out that the Wright model assumes data to be normally distributed, a common assumption in economic models, but this is not the case. After careful study of treasury yields since 1962 my conclusion is that the Wright model may understate the probability of recession in a low interest rate environment (as at present). The model places too much emphasis on the nominal level of short-term interest rates and ignores whether these rates are rising or falling. It also does not adequately explain the behavior of the market in 1966 and 2001 (see the first chart in this newsletter), when interest rates were low.
If you have built castles in the air, your work need not be
lost; that is where they should be. Now put the foundations
under them.
~ Henry David Thoreau
Technical Analysis and PredictionsI believe that Technical Analysis should not be used to make predictions because we never know the outcome of a particular pattern or series of events with 100 per cent certainty. The best that we can hope to achieve is a probability of around 80 per cent for any particular outcome: something unexpected will occur at least one in five times.My approach is to assign probabilities to each possible outcome. Assigning actual percentages would imply a degree of precision which, most of the time, is unachievable. Terms used are more general: "this is a strong signal"; "this is likely"; "expect this to follow"; "this is less likely to occur"; "this is unlikely"; and so on. Bear in mind that there are times, especially when the market is in equilibrium, when we may face several scenarios with fairly even probabilities. Analysis is also separated into three time frames: short, medium and long-term. While one time frame may be clear, another could be uncertain. Obviously, we have the greatest chance of success when all three time frames are clear. The market is a dynamic system. I often compare trading to a military operation, not because of its' oppositional nature, but because of the complexity, the continual uncertainty created by conflicting intelligence and the element of chance that can disrupt even the best made plans. Prepare thoroughly, but allow for the unexpected. The formula is simple: trade when probabilities are in your favor; apply proper risk (money) management; and you will succeed. For further background, please read About The Trading Diary. |
