Stock Indexes
By Colin Twiggs
September 30, 2006 0:30 a.m. ET (2:30 p.m. AET)
September 30, 2006 0:30 a.m. ET (2:30 p.m. AET)
The next newsletter (an update on Gold, Crude Oil and the
Dollar) will be on October 3rd.
These extracts from my daily trading diary are for educational purposes and should not be interpreted as investment advice. Full terms and conditions can be found at Terms of Use.
These extracts from my daily trading diary are for educational purposes and should not be interpreted as investment advice. Full terms and conditions can be found at Terms of Use.
The Big Picture
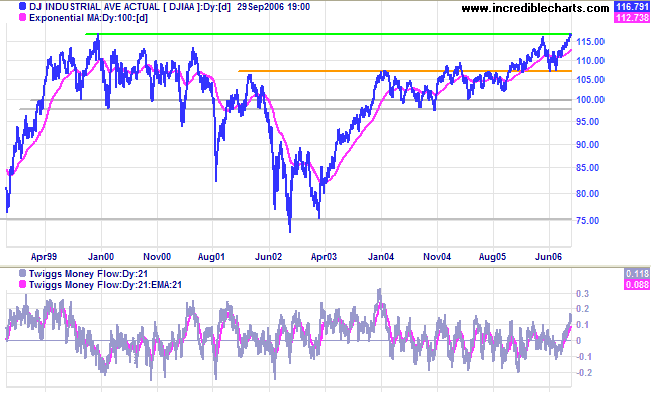
The Dow is testing its all-time high of 11723/11750 from
January 2000. A clear breakout would be a strong bull signal
for the entire equity market, but low volumes over
August-September continue to raise doubts over the commitment
of buyers. The Dow Transport Index signals
a possible reversal and, if lower fuel costs are sustained, we
could see a resurgence in economic activity. Falling long-term
interest rates may offer some relief to the beleaguered housing
market, but increased economic activity would raise
inflationary pressures and revive fears of further rate hikes
(you can't have your cake and eat it).
Gold is testing resistance at $600 and failure of this level could signal another (intermediate) rally. Crude oil prices are testing support at $60, while the dollar remains uncertain. The probability of recession in the next four quarters is rising, according to the Wright model, and is currently at 37 per cent.
Gold is testing resistance at $600 and failure of this level could signal another (intermediate) rally. Crude oil prices are testing support at $60, while the dollar remains uncertain. The probability of recession in the next four quarters is rising, according to the Wright model, and is currently at 37 per cent.
USA
The Dow Industrial Average broke through resistance at
the May high of 11650, but has so far failed to better the
all-time high of 11723/11750 set in January 2000. Increased
volumes between Monday and Wednesday [W] indicate profit-taking
and we can expect stern resistance in the next few weeks.
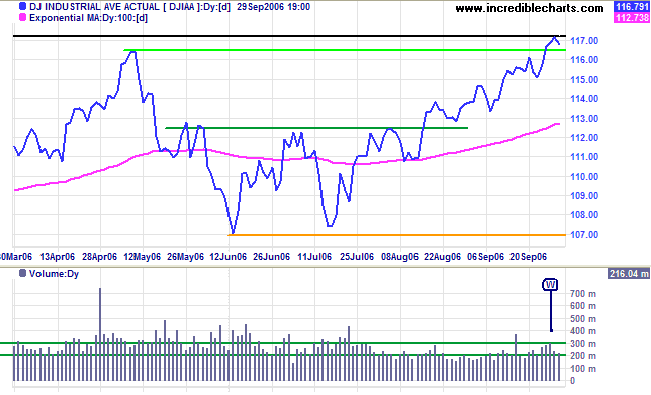
Medium Term: Narrow consolidation below resistance at
11720/50 would be a strong bull signal, while retracement below
11500 would be bearish.
Twiggs Money Flow (21-day), however, is rising steeply
above zero, signaling accumulation, but low volumes through
most of August-September raise doubt over buyers' ability to
break through long-term resistance.
Long Term: The Dow remains in a primary up-trend, with support at 10700.
Long Term: The Dow remains in a primary up-trend, with support at 10700.
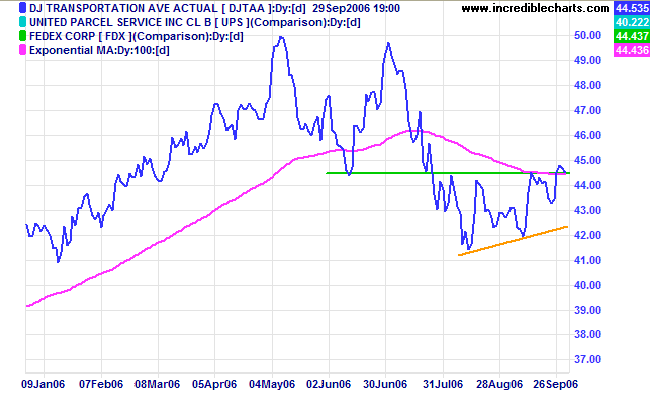
The Dow Jones Transportation Average broke through the
upper border of an
ascending triangle. If the latest retracement respects the
new support level at 4450 (the former primary support level),
this will clearly indicate that the down-trend is weak and we
may expect another test of resistance at 5000. Failure of the
new support level would signal continued uncertainty.
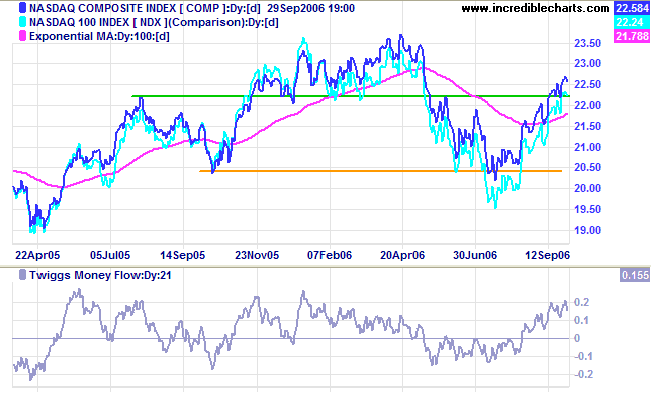
The Nasdaq Composite Index is rallying strongly above
the 100-day moving
average, and appears headed for a test of the April high of
2370.
Twiggs Money Flow (21-day) rising steeply above zero,
signals strong (medium-term)
accumulation.
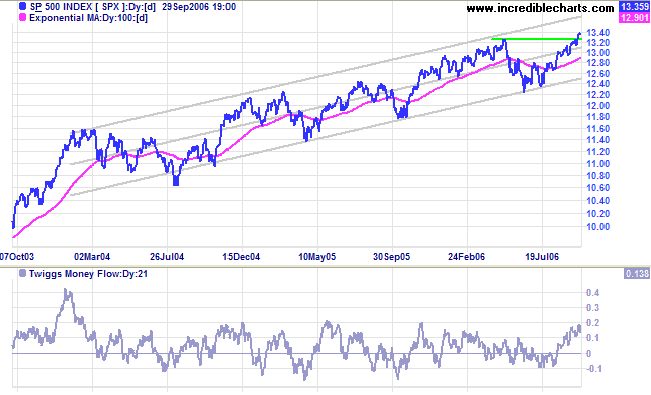
The S&P 500 broke through resistance at 1325 after a
short (bullish) retracement. Another retracement that respects
the new support level would add further confirmation. Expect a
test of the upper border of the linear regression channel. The
target is 1425 (1325 + {1325 - 1225}).
Medium Term:
Twiggs Money Flow (21-day) rising steeply above zero
signals (medium-term) accumulation.
Long Term: The S&P 500 continues in a slow primary up-trend, with support at 1220.
Long Term: The S&P 500 continues in a slow primary up-trend, with support at 1220.
United Kingdom
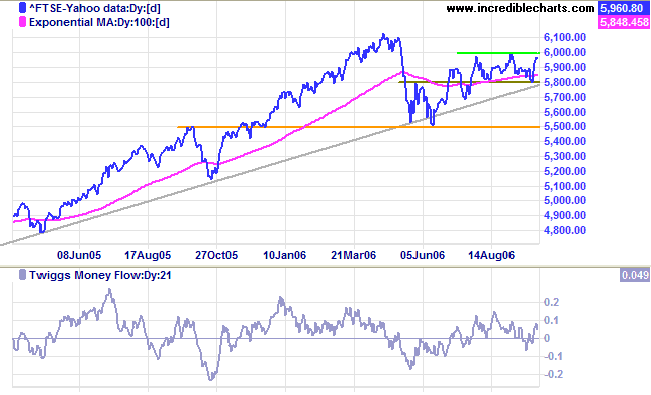
The FTSE 100 is consolidating between 6000 and 5800, with Twiggs Money Flow (21-day) whipsawing around the zero line, signaling indecision.
Medium Term: Continuation of the up-trend is likely, with a close above 6000 signaling resumption of the primary trend move. A break above 6100 would have a target close to the highs of 1999/2000. The target of 6700 is calculated as 6100 + {6100 - 5500}.
Penetration of support at 5800, however, would signal another test of support at 5500 -- and a break of the long-term trendline would warn of a primary trend reversal.
Long Term: The primary up-trend continues, with support at 5500.
Japan
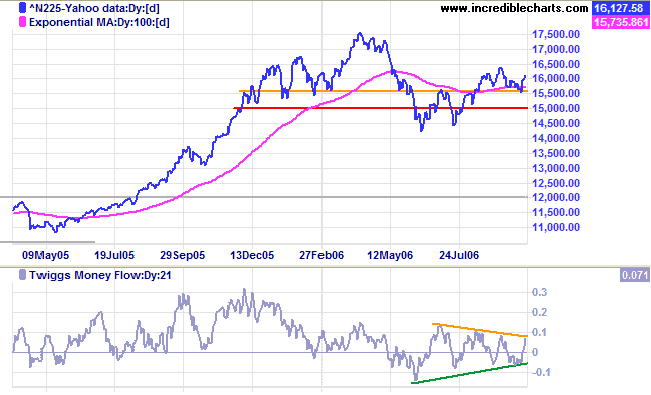
After a brief dip below support at 15700 the Nikkei 225 recovered and is rallying strongly. This is a bullish sign and a break through intermediate resistance at 16400 would confirm the strong up-trend.
Medium Term: Twiggs Money Flow (21-day) continues to oscillate around the zero line, signaling uncertainty. The next target for the up-trend is the April high of 17500, but we would need an improvement in TMF to achieve this.
Long Term: The primary up-trend remains up, with support at 14200.
ASX Australia
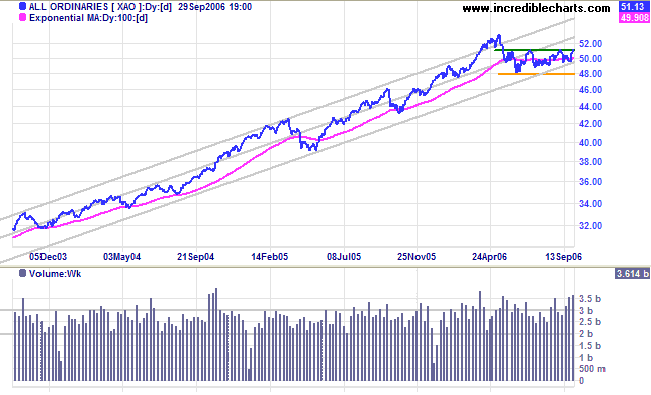
The All Ordinaries formed a double bottom at 4940 followed by a strong rally to break through resistance at 5100. Tall blue candles and exceptionally high volume indicate that buyers have regained control from sellers. Look for confirmation of the breakout from a pull-back that respects the new support level at 5100.
The All Ordinaries formed a double bottom at 4940 followed by a strong rally to break through resistance at 5100. Tall blue candles and exceptionally high volume indicate that buyers have regained control from sellers. Look for confirmation of the breakout from a pull-back that respects the new support level at 5100.
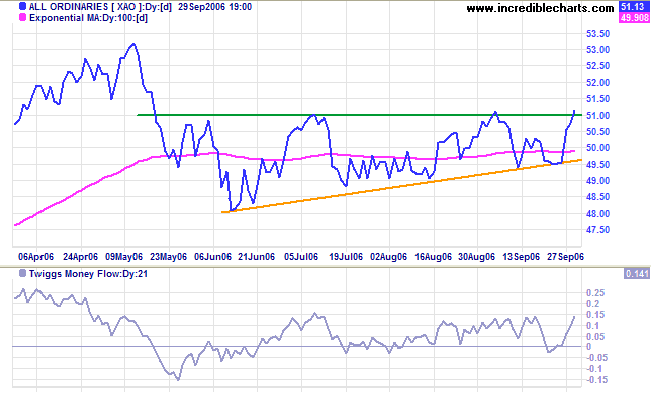
Medium Term: The breakout above 5100 completed a large
ascending triangle, with a target of 5400 (5100 + {5100 -
4800}). Expect a test of the upper border of the regression
channel below (after overcoming resistance at 5300/5350).
Twiggs Money Flow (21-day) recovered, after a brief dip
below zero, to signal long-term accumulation.
Long Term: The All Ordinaries continues in a primary up-trend with support at 4800.
Long Term: The All Ordinaries continues in a primary up-trend with support at 4800.
It isn't as important to buy as cheap as
possible as it is to buy at the right time.
~ Jesse Livermore
~ Jesse Livermore
For more background information, read About
the Trading Diary.