Low Volumes Hinder Trend
By Colin Twiggs
September 1, 2006 3:27 a.m. ET (5:27 p.m. AET)
September 1, 2006 3:27 a.m. ET (5:27 p.m. AET)
These extracts from my daily trading diary are for educational
purposes and should not be interpreted as investment advice.
Full terms and conditions can be found at
Terms of Use.
The Big Picture
Equity markets are edging upwards on low volumes, indicating a
lack of enthusiasm from buyers, and the Dow
Transport Index signals declining general economic
activity.
The negative yield differential is likely to cause problems in the months ahead, but falling long-term yields may revive the housing market.
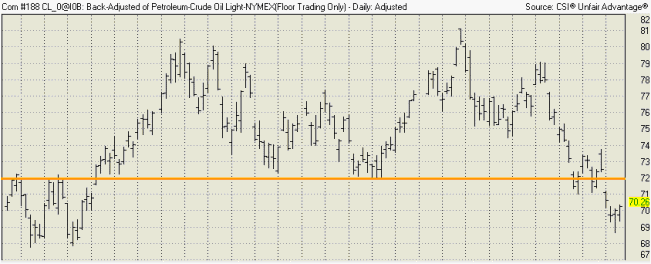
Crude oil fell through support at $71/$72, starting a primary down-trend. If this continues, expect gold to weaken.
The negative yield differential is likely to cause problems in the months ahead, but falling long-term yields may revive the housing market.
Crude oil fell through support at $71/$72, starting a primary down-trend. If this continues, expect gold to weaken.
USA
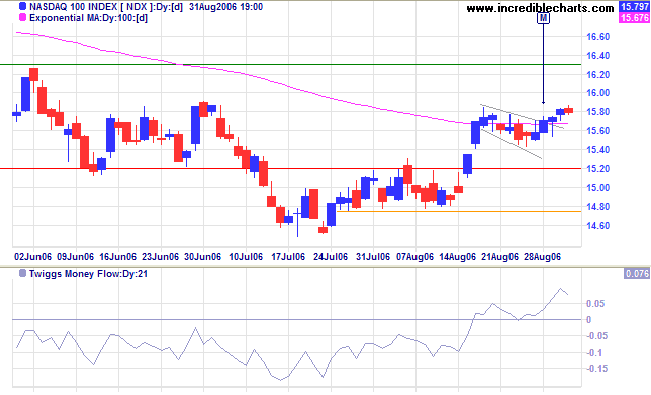
The Nasdaq 100 completed a flag on Monday, with a target
of the 1630 resistance level. Volume is rising but narrow
ranges between open and close indicate that buyers are
encountering opposition.
Twiggs Money Flow (21-day), however, suggests accumulation
as closes are near the daily highs.
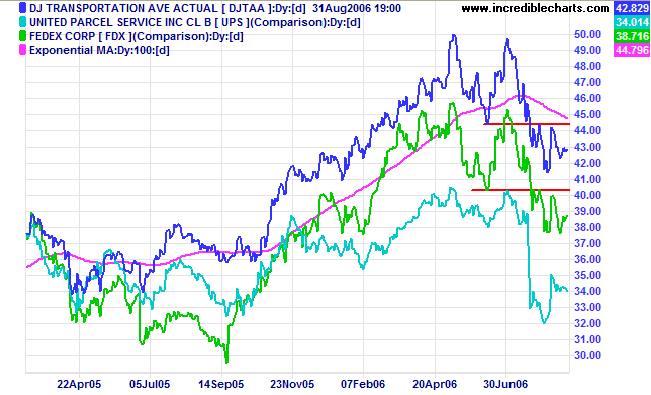
The Dow Jones Transportation Average and lead
indicators, Fedex and UPS, are all in primary down-trends --
signaling that the economy is slowing.
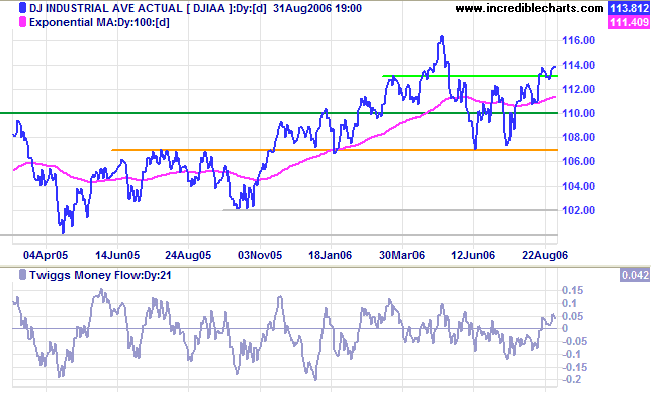
The Dow Industrial Average respected support at 11300
and appears headed for a test of the all-time high at 11650.
Continued low volumes place a question-mark over the index's
ability to break through this major resistance level.
Medium Term:
Twiggs Money Flow (21-day) is rising, signaling
accumulation.
Long Term: The Dow continues in a primary up-trend, with support at 10700.
Long Term: The Dow continues in a primary up-trend, with support at 10700.
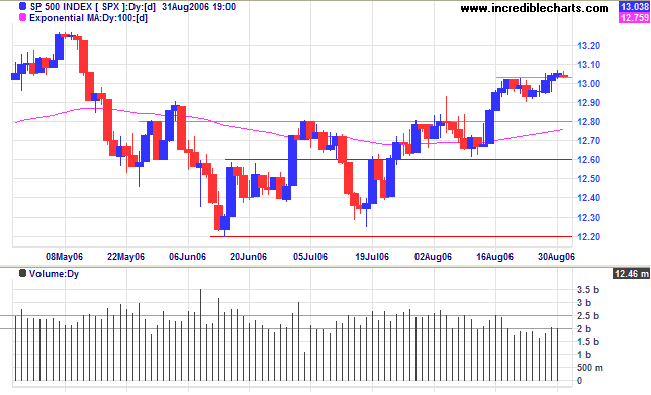
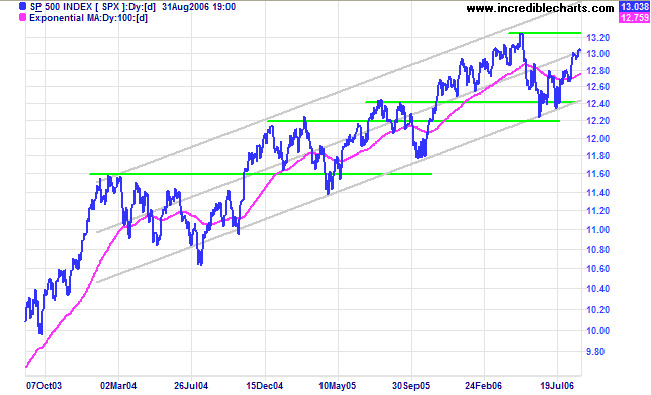
The S&P 500 completed a short retracement and
appears headed for a test of the May high at 1325. Again, low
volumes signal trend weakness.
Medium Term:
Twiggs Money Flow (21-day) is rising, signaling
accumulation.
Long Term: The S&P 500 is in a slow primary up-trend, with primary support at 1220. The index is oscillating in a channel around the linear regression line, with stubborn resistance at earlier highs and initial support levels often penetrated. The pattern appears set to continue.
Long Term: The S&P 500 is in a slow primary up-trend, with primary support at 1220. The index is oscillating in a channel around the linear regression line, with stubborn resistance at earlier highs and initial support levels often penetrated. The pattern appears set to continue.
Treasury yields
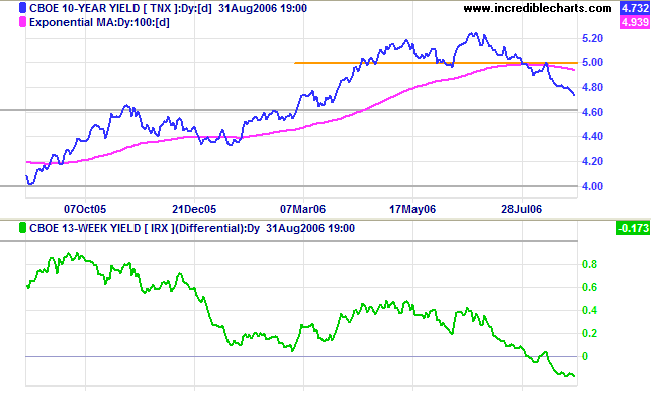
The yield on 10-year Treasury notes is falling steeply as inflation expectations are lowered.
Medium Term: Core consumer prices rose a low 0.1% in July, according to the Department of Commerce, confirming the Fed's view that the economy is slowing. However, the overall price index rose 0.3%, reflecting higher energy costs and the continuing threat of a resurgence in core inflation.
Long Term: The yield differential (10-year T-notes minus 13-week T-bills) is in negative territory, increasing the risk of a down-turn.
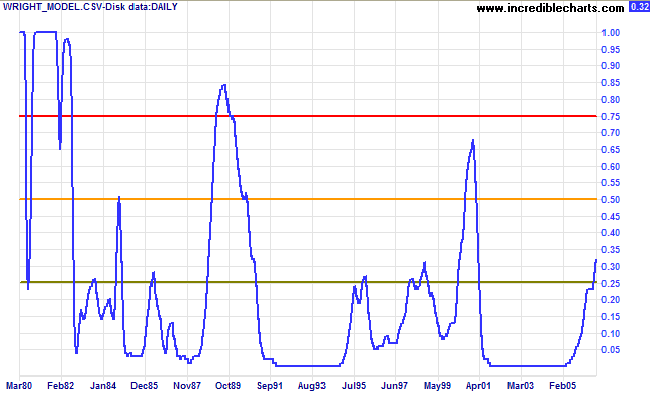
Probability of recession in the next four quarters increased to
32 per cent, according to the Wright
Model (developed by Fed economist Jonathan H Wright). A
spike that reaches 50% would warn of a stronger down-turn than
the "soft-landing" most investors hope for.
Gold
Spot gold continues to test support at $600. Falling crude oil prices should weaken gold and strengthen the dollar.
Medium Term: A reader correctly pointed out that the breakout from the recent large symmetrical triangle was close to the apex. The strongest signals are taken from breakouts two-thirds to three-quarters along the length of the triangle, though any breakout before the apex is still a valid signal. Penetration of support at $600 would be a strong bear signal. The target for the triangle breakout is $450: (630 - (730 - 550)), well below primary support at $540/$550.
Long Term: The primary trend remains up, but surrounded by uncertainty.
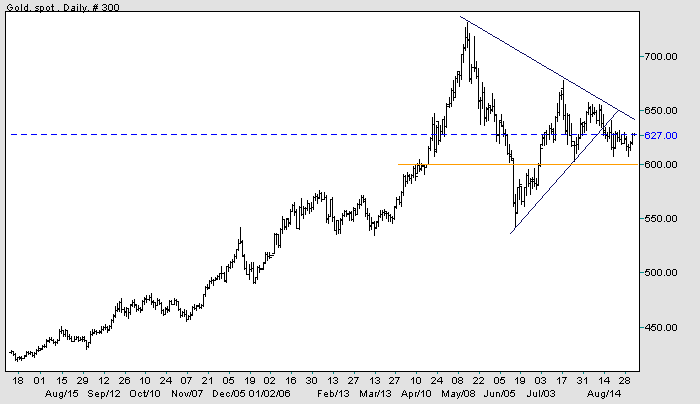
Source: Netdania
Crude Oil
Light Crude gapped below support to commence a primary down-trend, Friday's open-close reversal day giving early warning. Another pull-back may test the new resistance level; if it respects resistance at $71/$72 that will confirm the down-trend.
Light Crude gapped below support to commence a primary down-trend, Friday's open-close reversal day giving early warning. Another pull-back may test the new resistance level; if it respects resistance at $71/$72 that will confirm the down-trend.
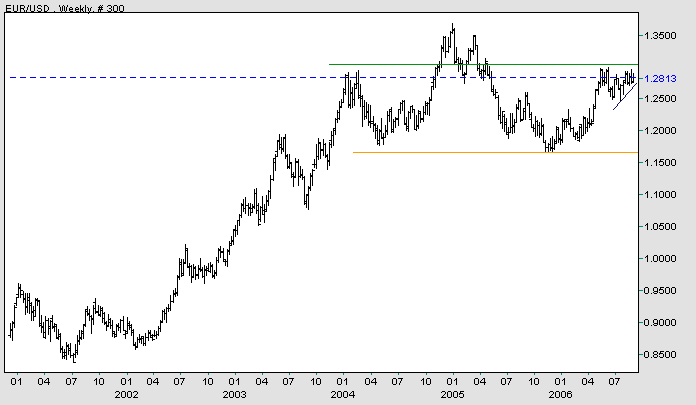
Currencies
The Euro is trending upwards, headed for another test of resistance at 1.30 dollars. The recent pattern does not qualify as an ascending triangle because the lower border has not been respected by two clear down-swings. However an upward breakout above 1.30 would signal a test of the all-time high at 1.35/1.36 (and a bullish sign for gold).
The Euro is trending upwards, headed for another test of resistance at 1.30 dollars. The recent pattern does not qualify as an ascending triangle because the lower border has not been respected by two clear down-swings. However an upward breakout above 1.30 would signal a test of the all-time high at 1.35/1.36 (and a bullish sign for gold).
Source: Netdania
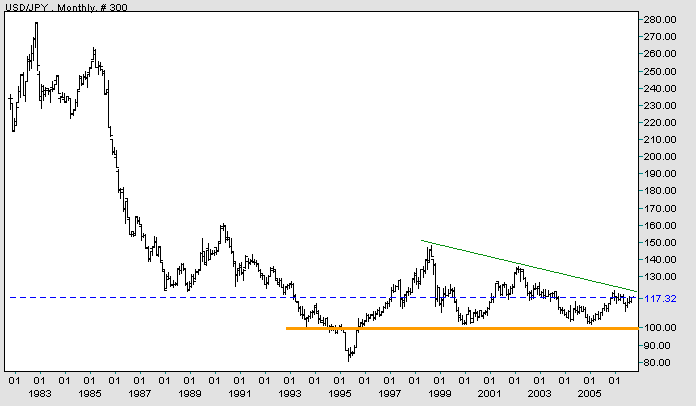
On the other side of the world, the dollar is strengthening
against the yen: testing the upper border of a long-term
descending triangle. An upward breakout would be a positive
sign, but the overall pattern is bearish.
Source: Netdania
United Kingdom
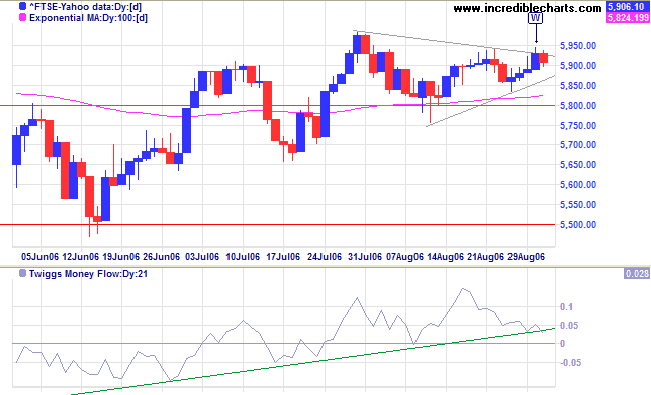
The FTSE 100 tested the upper border of the symmetrical triangle on Wednesday [W], but failed to breakout. Triangles are normally continuation patterns when found in an up-trend, the signal weakening as we approach the apex of the triangle. Watch for a breakout above 5950 or below 5850.
Medium Term: The intermediate trend is upwards. If Twiggs Money Flow (21-day) respects zero, that would be a bullish sign.
Long Term: The primary up-trend continues.
Japan
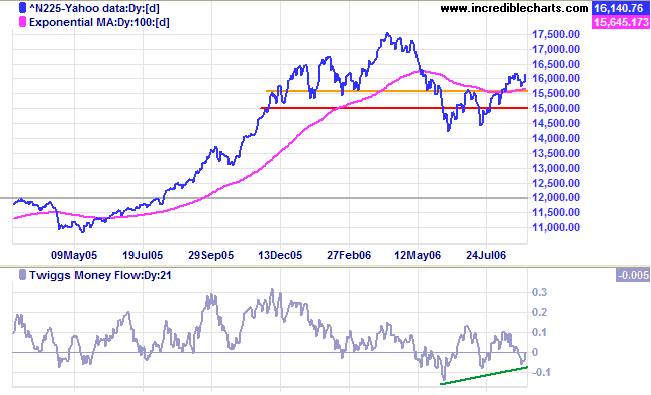
The Nikkei 225 pull-back respected the new support level at 15700, confirming the up-trend.
Medium Term: The index is in an intermediate up-trend and likely to test resistance at 17500. Twiggs Money Flow (21-day) is rising slowly, however, indicating continued uncertainty.
Long Term: The primary up-trend is up.
ASX Australia
The All Ordinaries is headed for a test of resistance at 5100 after Thursday's strong blue candle and big volume. Friday's short red candle and lower volume reveals some hesitancy, but should not change the direction of the trend.
The All Ordinaries is headed for a test of resistance at 5100 after Thursday's strong blue candle and big volume. Friday's short red candle and lower volume reveals some hesitancy, but should not change the direction of the trend.
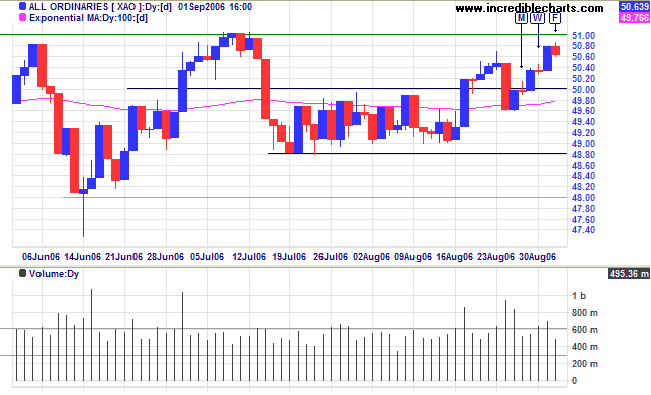
Medium Term: The latest retracement [F] will give a
strong indication as to future direction. A short duration
(two/three days) would be a strong bull signal, while a longer
retracement that ends below 5000 would be bearish.
I hesitate to call the pattern of the last 3 months an ascending triangle because the rectangle from [A] to [B] is not a regular down-swing. What is clear, however, is that 5100 is shaping up as a key resistance level and a breakout above this would be a bull signal. Twiggs Money Flow (21-day) is rising, signaling accumulation.
I hesitate to call the pattern of the last 3 months an ascending triangle because the rectangle from [A] to [B] is not a regular down-swing. What is clear, however, is that 5100 is shaping up as a key resistance level and a breakout above this would be a bull signal. Twiggs Money Flow (21-day) is rising, signaling accumulation.
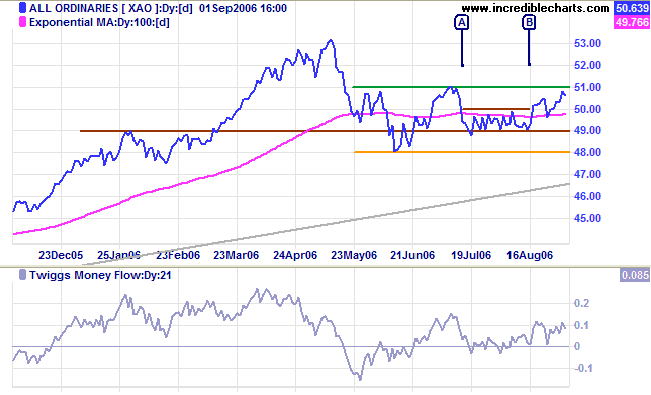
Long Term: The All Ordinaries is in a primary up-trend
with support at 4800.
Intuition isn't the enemy, but the ally, of
reason.
~ John Kord Lagemann
~ John Kord Lagemann
For more background information, read About
the Trading Diary.