Bear Alert
By Colin Twiggs
July 27, 2006
July 27, 2006
Apologies for the irregular timing of the newsletter. I am on a
brief visit to South Africa and feeling the effects of the
16-hour flight.
These extracts from my daily trading diary are for educational purposes and should not be interpreted as investment advice. Full terms and conditions can be found at Terms of Use.
These extracts from my daily trading diary are for educational purposes and should not be interpreted as investment advice. Full terms and conditions can be found at Terms of Use.
The Big Picture
The Nasdaq 100 has been joined by the
Dow Transportation Average in a primary
down-trend. If either the Industrial
Average or the S&P 500 reverses to a down-trend, we
will have a bear market. The S&P 500 is
struggling to recover above its 100-day
exponential moving average and appears the greater risk.
The FTSE and ASX show
signs of recovery, but should be treated with caution because
of the potential domino effect from the US.
The falling yield differential is further cause for concern. The slowing economy increases the likelihood of the Fed pausing in its cycle of rate hikes, but this is by no means certain.
Gold is weakening along with crude oil as the dollar strengthens.
The falling yield differential is further cause for concern. The slowing economy increases the likelihood of the Fed pausing in its cycle of rate hikes, but this is by no means certain.
Gold is weakening along with crude oil as the dollar strengthens.
USA
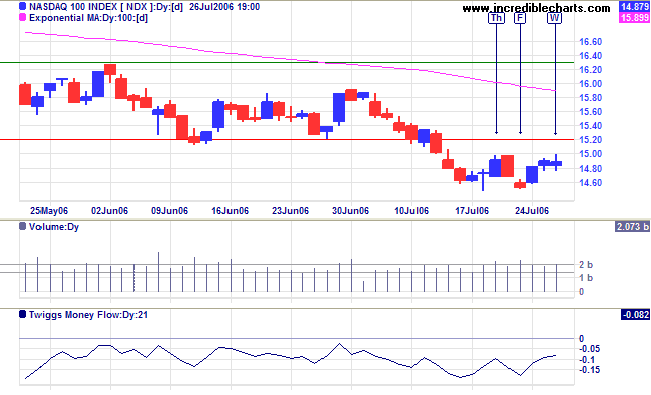
The Nasdaq 100 has so far respected resistance at
1500/1520 after breaking below the primary support level. A
close below 1450 would confirm the primary down-trend.
Twiggs Money Flow (21-day) signals strong
distribution.
Despite strong buying support on the last retracement
(highlighted by strong volume at [F]), the Dow Industrial
Average remains bearish. Only a breakout above resistance
at 11300 is likely to change this. The doji
candle at [W] indicates uncertainty and a fall below 11000
would mean another retracement.
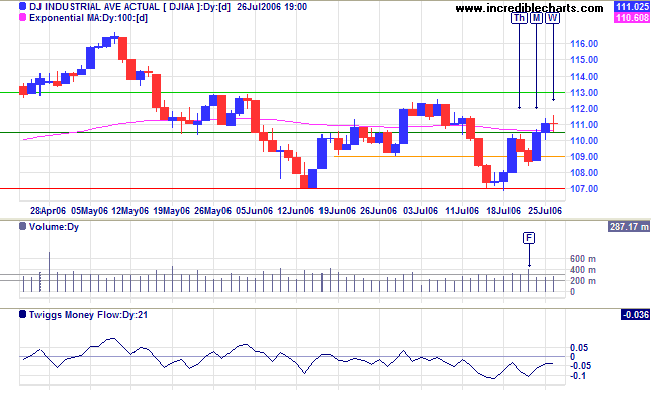
Medium Term: A break above 11300 would complete a
double bottom, identified by [a] and [b] below, and signal
a test of the previous high of 11650. However,
Twiggs Money Flow (21-day) continues to signal
distribution, holding below the zero line for the past 4 weeks.
A close below Friday's low would signal another test of primary
support.
Long Term: The Dow is in a primary up-trend, but a fall below 10700 would mean a reversal.
Long Term: The Dow is in a primary up-trend, but a fall below 10700 would mean a reversal.
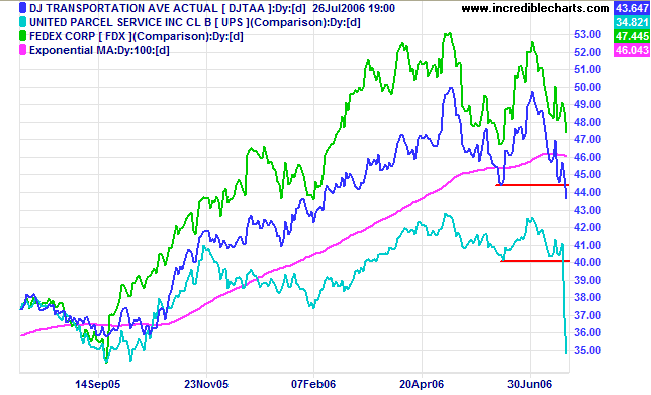
The market hammered UPS -- down more than 10% -- after a 43%
increase in their fuel costs for the quarter. The fall dragged
Dow Jones Transportation Average below its June low,
signaling a primary trend reversal. The "bull market" is now
officially over. A reversal by Fedex would complete the gloomy
picture.
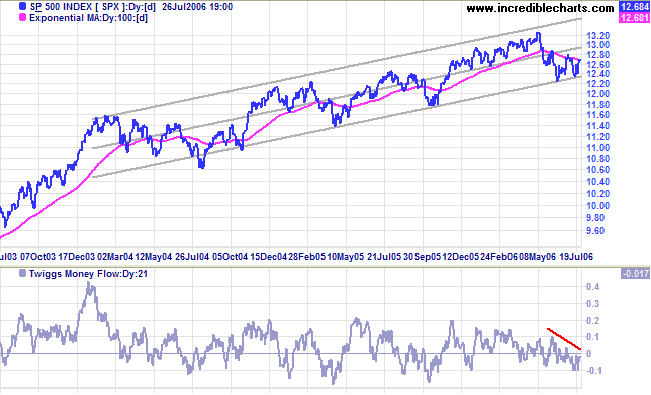
The S&P 500 formed a
symmetrical triangle highlighted by dark blue lines
below. What makes this particularly bearish is its
position below the 100-day
exponential moving average, with the last two peaks at [a]
and [b] respecting the MA.
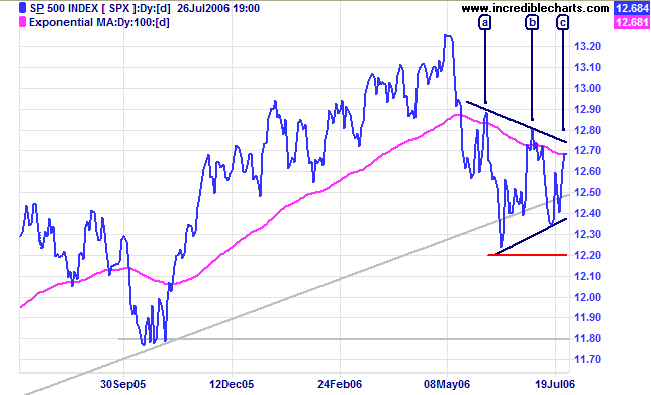
Medium Term: If the latest rally at [c] also respects
the 100-day MA that would be particularly worrying. A breakout
below the lower border of the pattern would threaten primary
support at 1220.
Twiggs Money Flow (21-day) appears weak. On the other hand,
an upward breakout would suggest a test of the recent high at
1325.
Long Term: The S&P 500 is in a slow up-trend, oscillating within a channel drawn at 2 standard deviations around a linear regression line. A fall below the lower border of the channel would be bearish -- and a close below 1220 would signal a primary trend reversal.
Long Term: The S&P 500 is in a slow up-trend, oscillating within a channel drawn at 2 standard deviations around a linear regression line. A fall below the lower border of the channel would be bearish -- and a close below 1220 would signal a primary trend reversal.
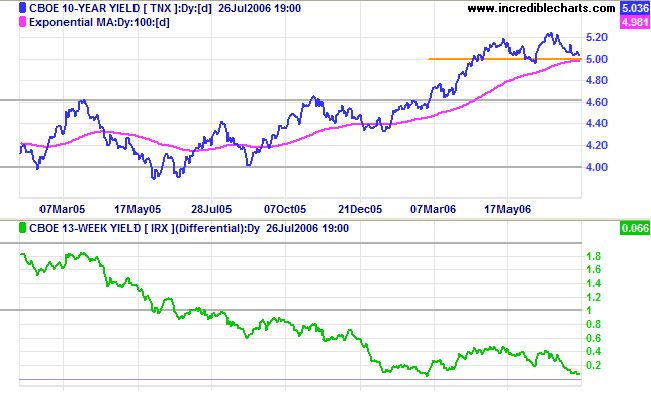
Treasury yields
The yield on 10-year Treasury notes has so far respected support at 5.0%, a positive sign.
Medium Term: Long-bond yields are likely to respect their 100-day exponential moving average and continue in an up-trend.
Long Term: The yield differential (10-year T-notes minus 13-week T-bills) is close to zero and cause for concern. A negative yield differential/yield curve would make the economy extremely vulnerable.
The Wright
Model, developed by Fed economist Jonathan H Wright,
calculates the probability of recession in the next four
quarters. While still a modest 26 per cent, the rapid
rise reflects a deteriorating situation.
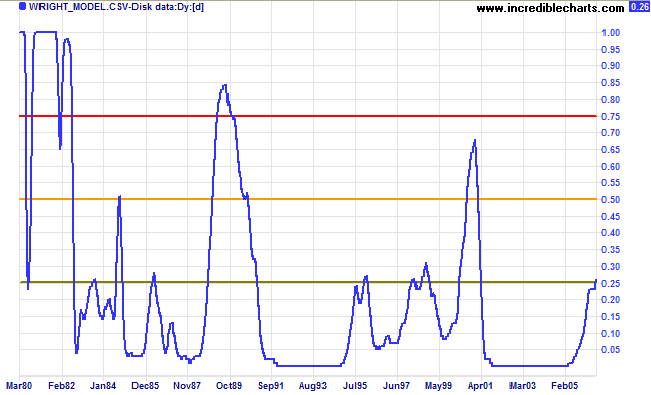
The three colors on the Wright chart should be interpreted as
follows:
- probability rises above 25%: while not yet cause for concern, watch the indicator regularly for signs of further deterioration;
- above 50%: the situation is becoming volatile -- so exercise caution;
- above 75% means dire risk of an economic downturn.
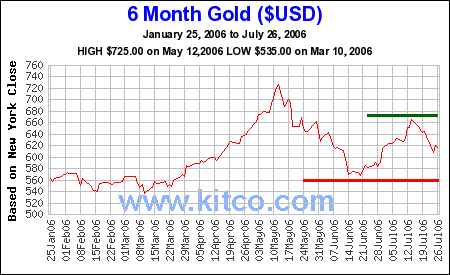
Gold
Spot gold is retracing on the back of a stronger dollar. The index briefly broke through support at $620 before recovering to above $630.
Medium Term: Expect another test of resistance at $680. Failure to break out above this level would again place support at $620 under threat.
Long Term: Gold continues in an up-trend, with primary support at $540.
Crude Oil
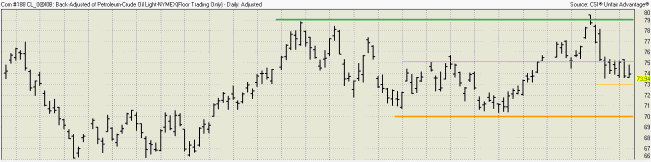
Light Crude broke through initial support at $75 and is now consolidating below the support level. This is a bearish sign and we can expect a test of primary support at $70. Recovery above $75, on the other hand, would indicate another test of resistance at $79/$80.
Light Crude broke through initial support at $75 and is now consolidating below the support level. This is a bearish sign and we can expect a test of primary support at $70. Recovery above $75, on the other hand, would indicate another test of resistance at $79/$80.
Currencies
The dollar is strengthening against major trading partners in the short-term.
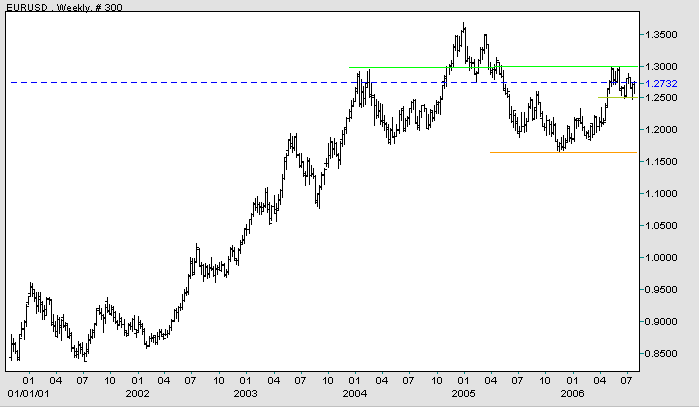
EUR/USD: The euro is consolidating between support at 1.25 and resistance at 1.30. An upward breakout would signal a test of the previous all-time high of 1.37. A downward breakout would signal a test of support at 1.185/1.165.
Long-term: A fall below 1.165 would complete a major head and shoulders reversal (with a target of 0.97: 1.17 - (1.37 - 1.17)).
The dollar is strengthening against major trading partners in the short-term.
EUR/USD: The euro is consolidating between support at 1.25 and resistance at 1.30. An upward breakout would signal a test of the previous all-time high of 1.37. A downward breakout would signal a test of support at 1.185/1.165.
Long-term: A fall below 1.165 would complete a major head and shoulders reversal (with a target of 0.97: 1.17 - (1.37 - 1.17)).
Source: Netdania
United Kingdom
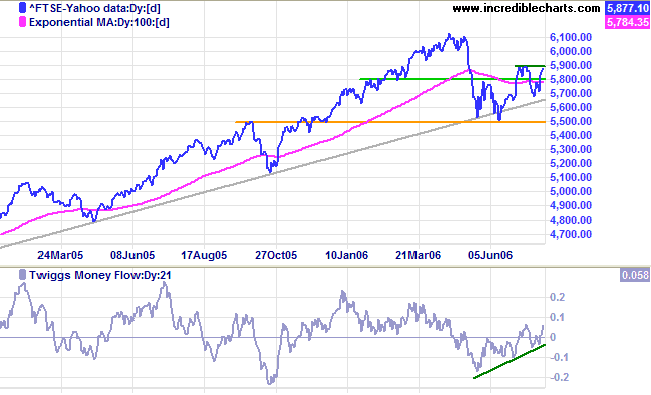
The FTSE 100 is trending upwards and would receive further confirmation from a rise above 5900.
Medium Term: A rise above 5900 would signal a test of 6130, while reversal below 5700 would mean another test of primary support. Twiggs Money Flow (21-day) is trending upwards, signaling accumulation.
Long Term: The primary up-trend is intact.
Japan
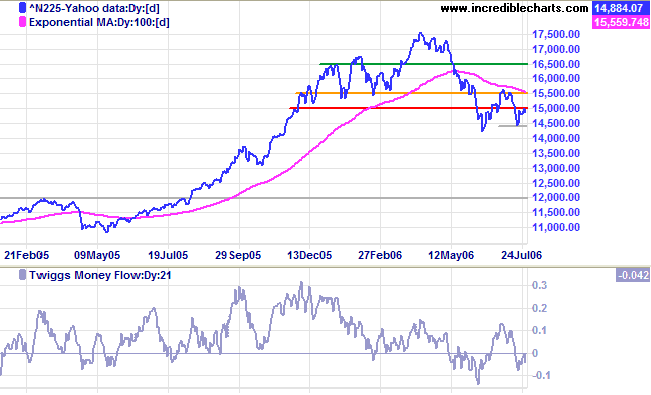
The Nikkei 225 is currently trading at 15180. If it can hold above 15000, that would be a positive sign, but reversal below 15000 would be a stronger bear signal.
Medium Term: A close below 14400 would reinforce the bear signal and below 14200 would confirm the primary down-trend. Above 15500, on the other hand, would signal the (doubtful) start of an up-trend.
Long Term: The index is in a primary down-trend, with support at 14200, 13000 and major support at 12000.
ASX Australia
The All Ordinaries is consolidating in a narrow band between 4880 and 4980, with rising volume indicating support. Expect another test of resistance at 5100, but a fall below 4880 would mean another test of primary support at 4800.
The All Ordinaries is consolidating in a narrow band between 4880 and 4980, with rising volume indicating support. Expect another test of resistance at 5100, but a fall below 4880 would mean another test of primary support at 4800.
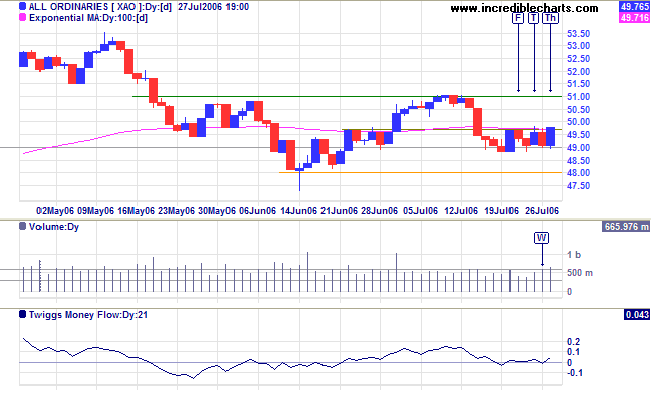
Medium Term: A rise above 5100 would indicate that a
test of the upper channel line is likely.
Twiggs Money Flow (21-day) rising above zero signals
accumulation.
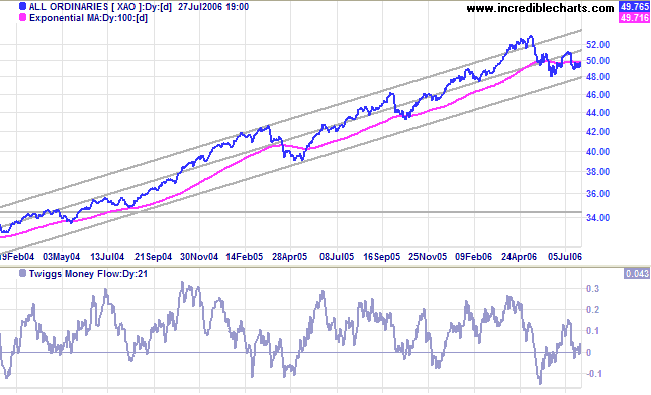
Long Term: The All Ordinaries is in a primary up-trend,
but a close below support at 4800 would change this.
We of an older generation can get along with
what we have, though with growing hardship; but in your full
manhood and womanhood you will want what nature once so
bountifully supplied and man so thoughtlessly destroyed; and
because of that want you will reproach us, not for what we have
used, but for what we have wasted...So any nation which in its
youth lives only for the day, reaps without sowing, and
consumes without husbanding, must expect the penalty of the
prodigal whose labor could with difficulty find him the bare
means of life.
~ Theodore Roosevelt (Arbor Day message to the school children of the United States, April 1907)
~ Theodore Roosevelt (Arbor Day message to the school children of the United States, April 1907)
For more background information, read About
the Trading Diary.