Nasdaq Retraces
By Colin Twiggs
July 20, 2006
July 20, 2006
We will be trialing a mid-week update and a Monday morning
update for the next few weeks, rather than the regular weekend
update. Your feedback
will be appreciated.
These extracts from my daily trading diary are for educational purposes and should not be interpreted as investment advice. Full terms and conditions can be found at Terms of Use.
These extracts from my daily trading diary are for educational purposes and should not be interpreted as investment advice. Full terms and conditions can be found at Terms of Use.
The Big Picture
The Nasdaq 100 is testing resistance at the
former primary support level. This could be an important
indication for the direction of technology stocks. Respect of
the resistance level would confirm the primary down-trend,
while failure of resistance would be a bullish sign. The Dow,
S&P 500, FTSE and ASX all show signs of recovery, but may
still be affected by a weak technology sector. The Nikkei is in
a primary down-trend.
We are not yet out of the woods. The low yield differential is cause for concern:. Any further rate hikes are likely to invert the yield curve, increasing the risk of an economic down-turn. The Fed, on the other hand, is unlikely to delay further rates increases unless it is clear that inflationary pressures have eased. They cannot afford to have their credentials as inflation hawks questioned.
Gold demand has been tempered by a stronger dollar. Any weakness in the currency would lead to a resurgence.
USA
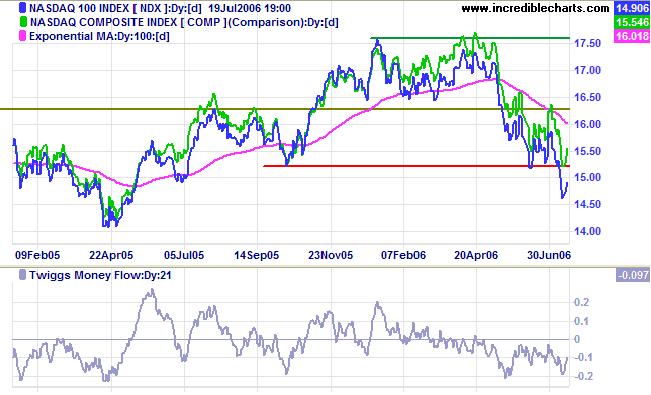
The Nasdaq Composite index respected its primary support
level, a positive sign, while the Nasdaq 100 is
retracing to test resistance at 1520 after breaking below the
primary support level. An NDX close above 1520 would signal a
bullish
bear trap.
Twiggs Money Flow (21-day) signals
distribution, but a rise above zero would be a bullish
sign.
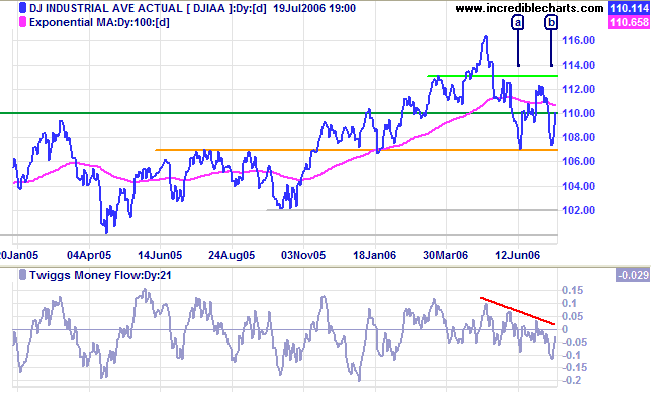
The Dow Industrial Average respected primary support at
10700 and appears headed for a test of resistance at
11250/11300.
Medium Term: A rise above 11300 would complete a
double bottom, identified by [a] and [b] below, and signal
a test of the previous high of 11650. After declining for
several weeks,
Twiggs Money Flow (21-day) will remain weak until the
down-trend (indicated by a red line) reverses.
Long Term: The Dow is in a primary up-trend, but a fall below 10700 would mean a reversal.
Long Term: The Dow is in a primary up-trend, but a fall below 10700 would mean a reversal.
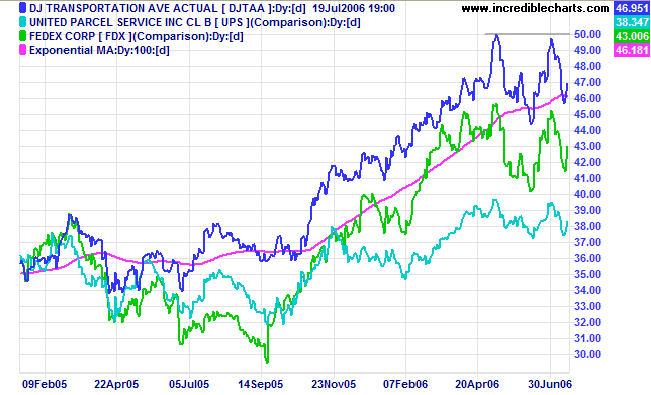
The Dow Jones Transportation Average recovered to above
its 100-day
exponential moving average and appears headed for another
test of resistance at 5000. Lead indicators, Fedex and UPS,
reflect a similar pattern and all three indicators remain in a
primary up-trend.
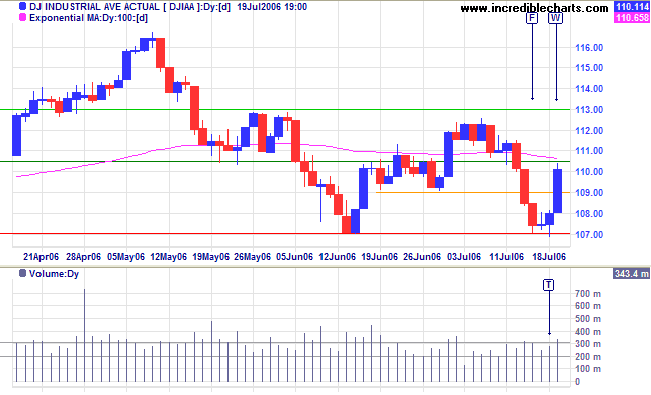
The S&P 500 respected primary support at 1220, with
long tails from Friday [F] to Tuesday [T] indicating buying
support before a strong blue candle on Wednesday [W].
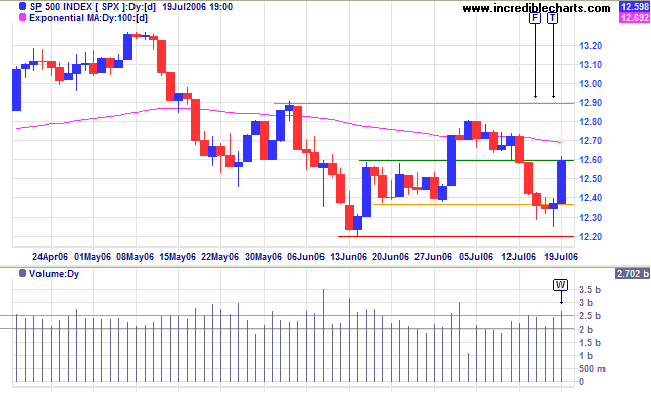
Medium Term: A rise above 1280/1290 would be a bullish
sign, signaling a test of the previous high at 1330.
Twiggs Money Flow (21-day) remains weak.
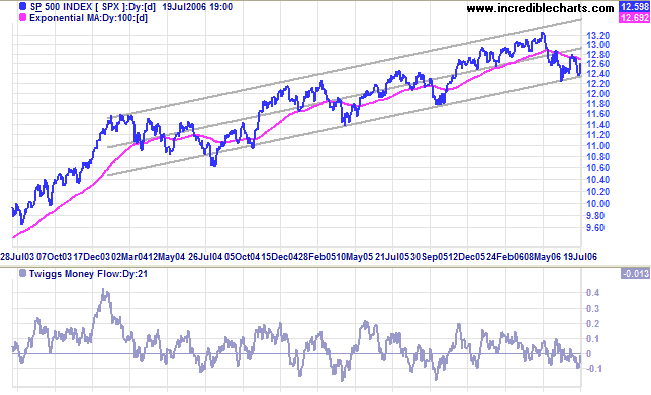
Long Term: The S&P 500 is in a slow up-trend, oscillating within a channel drawn at 2 standard deviations around a linear regression line. Having twice respected the lower channel line the probability is swinging towards a test of the upper channel line.
Long Term: The S&P 500 is in a slow up-trend, oscillating within a channel drawn at 2 standard deviations around a linear regression line. Having twice respected the lower channel line the probability is swinging towards a test of the upper channel line.
Treasury yields
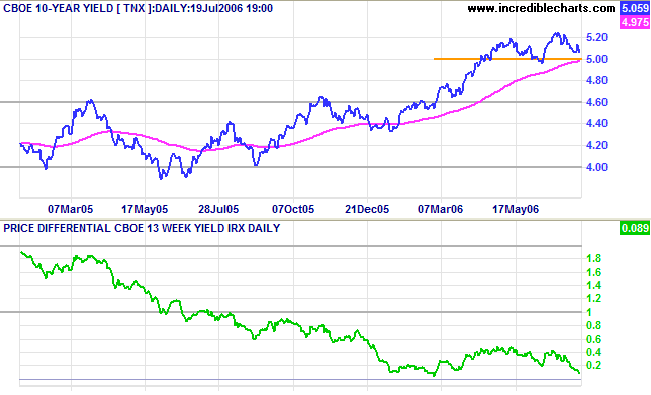
The yield on 10-year Treasury notes is headed for a test of support at 5.0%.
Medium Term: Long-bond yields are likely to respect their 100-day exponential moving average and continue in an up-trend.
Long Term: The yield differential (10-year T-notes minus 13-week T-bills) is headed for a test of zero. A negative yield differential/yield curve would make the economy extremely vulnerable if short-term rates continue to rise.
The Wright
Model, developed by Fed economist Jonathan H Wright,
calculates the probability of recession in the next four
quarters as 25 per cent. While still at modest levels,
the rising probability reflects a deteriorating situation
rather than an improving one.
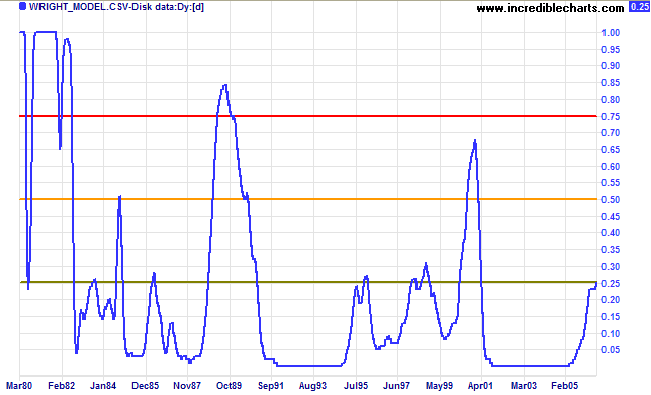
I have added three colors to the Wright chart:
- if the probability rises above 25%, while there is not yet cause for concern, stay alert;
- above 50%, the situation could quickly deteriorate -- exercise caution;
- above 75% indicates dire risk of an economic downturn.
Gold
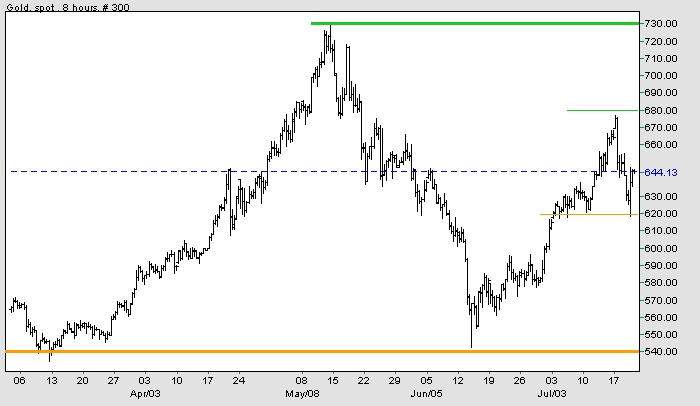
After reaching $680, spot gold started to retrace on the back of a stronger dollar. After a brief consolidation at $650 the index broke through support to test $620 before bouncing back sharply.
Medium Term: A breakout above $650 would signal another test of $680, while failure to break out would be a bearish sign, placing support at $620 under threat.
Long Term: Gold continues in an up-trend, with primary support at $540. The gold-oil ratio is 8.6 (up-turns below 10 normally signal buying opportunities, while down-turns above 20 indicate selling opportunities). Higher crude oil prices, inflation and a weakening dollar would boost the gold price, while higher interest rates and a strengthening dollar would weaken the price.
Source: Netdania
Crude Oil
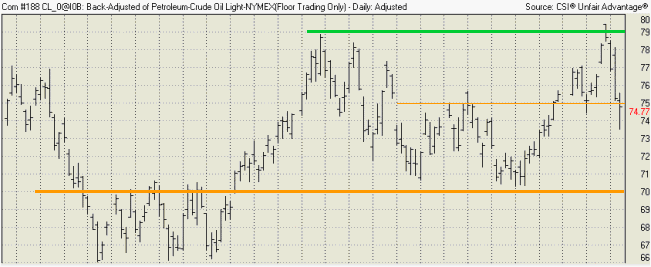
After a false break above the previous high, Light Crude retreated to test initial support at $75. The long tail on the latest bar shows plenty of buying support, but the close remains below $75/barrel and therefore prone to further weakness. A fall below the latest low would signal a test of primary support at $70, while recovery to above $75 would indicate another test of resistance at $79/$80.
After a false break above the previous high, Light Crude retreated to test initial support at $75. The long tail on the latest bar shows plenty of buying support, but the close remains below $75/barrel and therefore prone to further weakness. A fall below the latest low would signal a test of primary support at $70, while recovery to above $75 would indicate another test of resistance at $79/$80.
Currencies
The dollar is strengthening against major trading partners in the short-term, but in the long-term is approaching a possible major turning point.
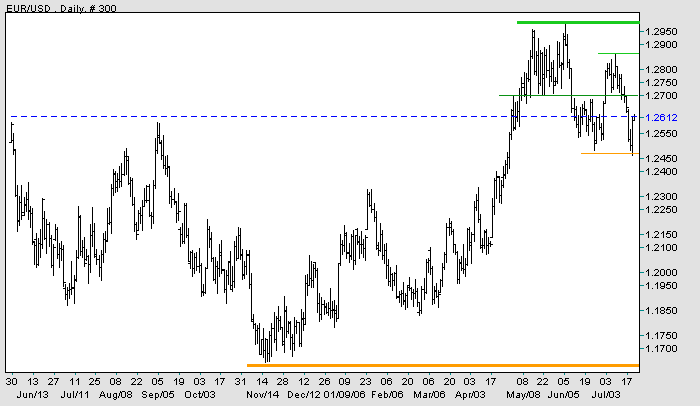
EUR/USD: The euro successfully tested short-term support at 1.25, but if it fails to recover above the first line of resistance at 1.27, that would be a bearish signal. A recovery above 1.27 would still have to break resistance at 1.285 before entering positive territory.
Long-term: A fall below 1.185/1.165 would complete a major head and shoulders reversal (with a target of 0.97: 1.17 - (1.37 - 1.17)), while a rise above 1.30 would mean a test of the previous all-time high of 1.37.
The dollar is strengthening against major trading partners in the short-term, but in the long-term is approaching a possible major turning point.
EUR/USD: The euro successfully tested short-term support at 1.25, but if it fails to recover above the first line of resistance at 1.27, that would be a bearish signal. A recovery above 1.27 would still have to break resistance at 1.285 before entering positive territory.
Long-term: A fall below 1.185/1.165 would complete a major head and shoulders reversal (with a target of 0.97: 1.17 - (1.37 - 1.17)), while a rise above 1.30 would mean a test of the previous all-time high of 1.37.
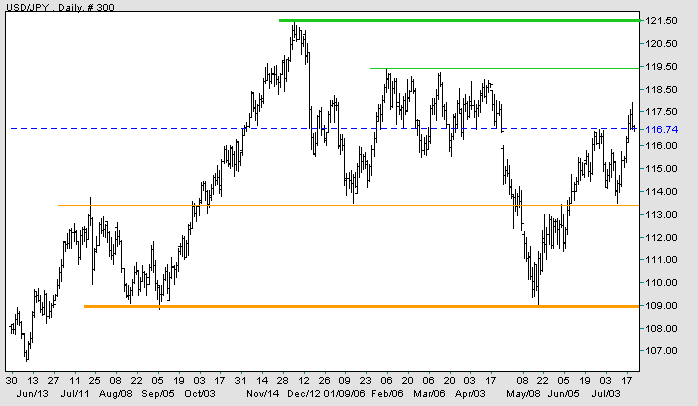
USD/JPY: The dollar is in a healthy up-trend against the yen.
Expect some resistance at 119.5 before a test of 121.50.
Long-term: A rise above the high of 121.50 would break a bearish descending triangle started in 1998 and signal the possible start of a major up-trend. A fall below 100, however, would signal continued weakness.
Long-term: A rise above the high of 121.50 would break a bearish descending triangle started in 1998 and signal the possible start of a major up-trend. A fall below 100, however, would signal continued weakness.
Source: Netdania
United Kingdom
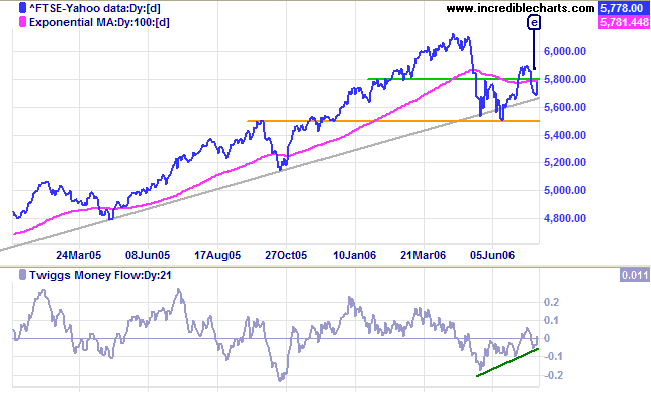
The FTSE 100 appears bullish, with the recent dip below 5800 respecting the long-term trendline and failing to reach primary support at 5500.
Medium Term: A close above 5800 would be encouraging, while a rise above the recent high would signal a test of 6130. Failure to cross above 5800 or the 100-day exponential moving average, however, would warn of another test of primary support at 5500. Twiggs Money Flow (21-day) is trending upwards, signaling accumulation.
Long Term: The primary up-trend is intact.
Japan
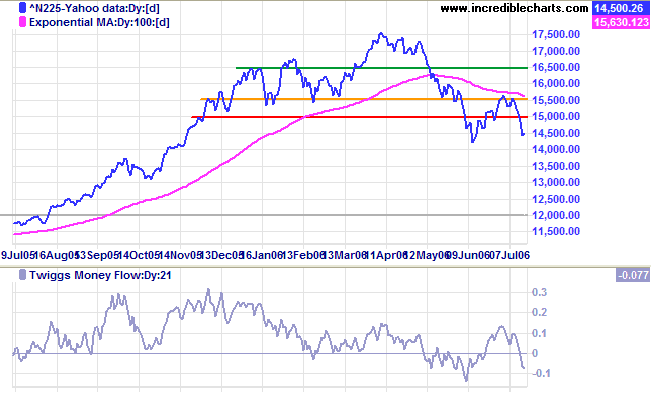
The Bank of Japan ended its former zero interest rate policy, raising the discount rate to a quarter per cent.
After falling through support the Nikkei 225 seems headed for a test of the new resistance level at 15000. If resistance holds that would confirm the primary down-trend.
Medium Term: If resistance at 15000 fails we may see a consolidation pattern emerge between 14000 and 15500. If the index continues to respect the 100-day exponential moving average from below, that would strengthen the bear signal.
Long Term: The index is in a primary down-trend, with support at 14000, 13000 and major support at 12000.
ASX Australia
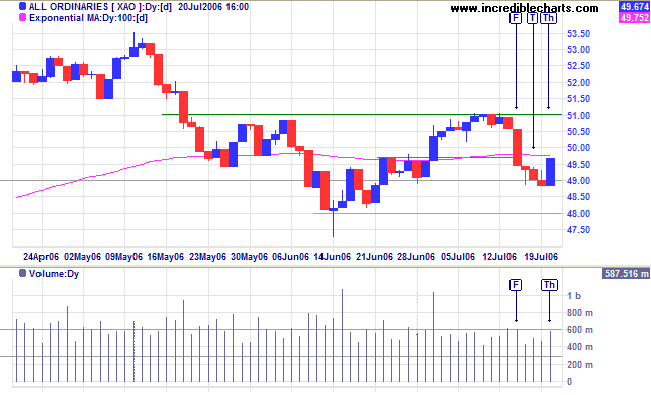
The All Ordinaries followed US markets higher after encountering support at 4900. A close above 5100 would signal continuation of the up-trend, signaling a test of the previous high of 5350. Reversal while below the 100-day exponential moving average, however, would signal another test of primary support at 4800.
The All Ordinaries followed US markets higher after encountering support at 4900. A close above 5100 would signal continuation of the up-trend, signaling a test of the previous high of 5350. Reversal while below the 100-day exponential moving average, however, would signal another test of primary support at 4800.
Medium Term: The index continues to trend upward within
the linear regression channel plotted on the long-term chart. A
rise above 5100 would indicate that a test of the upper channel
line is likely.
Twiggs Money Flow (21-day) has returned to above zero.
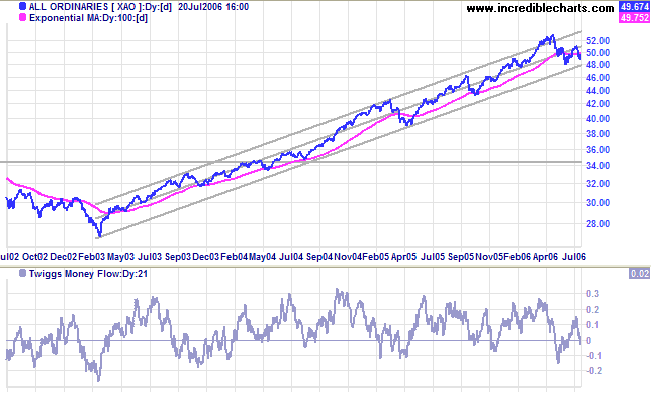
Long Term: The All Ordinaries is in a primary up-trend,
however, a close below support at 4800 would signal a reversal.
It is not the critic who counts: not the man
who points out how the strong man stumbles or
where the doer of deeds could have done better. The credit belongs to the man who is actually
in the arena, whose face is marred by dust and sweat and blood, who strives valiantly, who
errs and comes up short again and again, because there is no effort without error or
shortcoming, but who knows the great enthusiasms, the great devotions, who spends himself
for a worthy cause; who, at the best, knows, in the end, the triumph of high achievement, and
who, at the worst, if he fails, at least he fails while daring greatly, so that his place shall never
be with those cold and timid souls who knew neither victory nor defeat.
~ Theodore Roosevelt
For more background information, read About
the Trading Diary.