Trading Diary
June 17, 2006
These extracts from my daily trading diary are for educational
purposes and should not be interpreted as investment advice. Full
terms and conditions can be found at Terms
of Use.
USA
The Big Picture: The market is in a broad secondary
correction after the S&P 500 failed to
hold above 1250. The NASDAQ is the weakest of
the three major indexes and we should watch for signs of a
primary trend reversal: failure of one index will tend to drag
the others down.
The dollar found short-term support as interest rates rises appear inevitable. Higher rates will slow the property market, and retail sales to a lesser degree, while a strong dollar would dampen export sales. The Wright Model reflects the risk of an economic downturn as modest, but this may change if short-term rates continue to rise and/or the yield curve becomes inverted (when short-term rates rise faster than long-term yields).
Gold is likely to hold above primary support at $535 for the time being, but a decline in the dollar would most likely lead to another rally. Crude oil is testing support at $69/barrel. A fall below this level would be a bearish sign for gold.
The Primary Cycle: Crude prices rise >> Concerns over Inflation >> Sales of US dollar >> Purchases of Gold >> Rising energy prices have a lagged impact on Core Inflation >> Fed raises interest rates to counter Inflation >> Purchases of US dollar >> Sales of Gold >> High interest rates slow Property and Retail Sales >> Strong dollar slows Exports >> Earnings fall >> Markets fall >> Consumption falls >> Crude prices fall as demand shrinks >> Falling energy prices and Consumption have a lagged impact on Core Inflation >> Fed lowers interest rates >> Consumption slowly recovers >> Earnings Rise >> Markets rise >> Consumption increases..... and another cycle begins.
The Dow Industrial Average retraced to test the new
resistance level at 11050. Large volumes on Friday are from the
triple-witching
hour. The doji
star candle at [5] shows indecision; and a fall below 10900
(the mid-point of [4]) would signal another test of support at
10700.
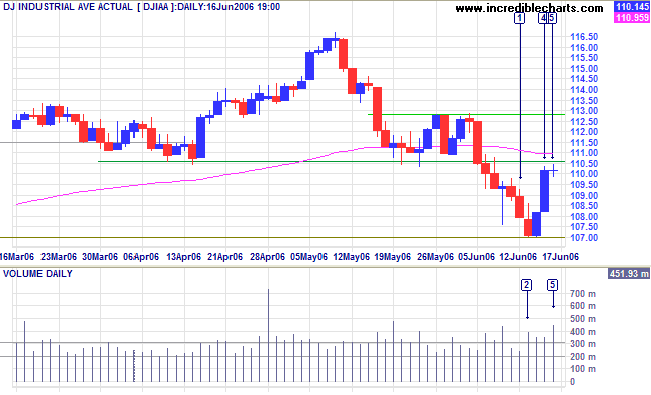
Medium Term: The index remains below the 100-day
exponential moving average and in a secondary correction. A
rise above 11300 would signal resumption of the up-trend and a
likely test of 11650, while a close below 10700 would signal
continuation of the secondary correction.
Twiggs Money Flow (21-day) continues to whipsaw around the
zero line, signaling uncertainty.
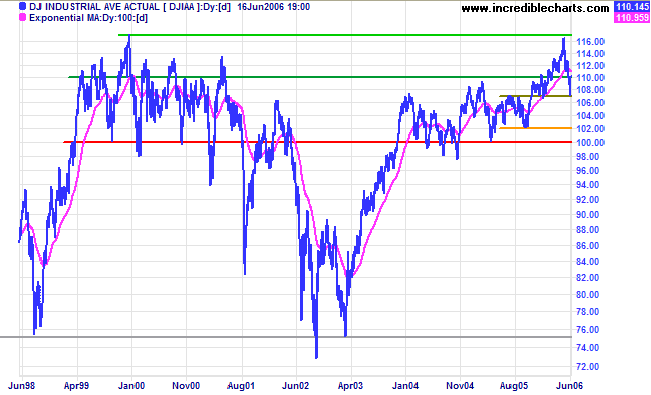
Long Term: Both the Dow Industrial and Transport Averages are in primary up-trends, confirming a bull market despite current turbulence. The retreat since testing the all-time high of 11600/11700 encountered initial support at 10700 rather than 11000, signaling continued trend weakness (by this I mean a slow up-trend rather than an imminent reversal). Recovery above 11000 would be bullish, signaling another test of 11600. A strong secondary correction, below 10700, however, would warn that the index may be entering a stage 3 top; a fall below 10200 would warn of a primary trend reversal; while a close below 10000 would confirm this.
Long Term: Both the Dow Industrial and Transport Averages are in primary up-trends, confirming a bull market despite current turbulence. The retreat since testing the all-time high of 11600/11700 encountered initial support at 10700 rather than 11000, signaling continued trend weakness (by this I mean a slow up-trend rather than an imminent reversal). Recovery above 11000 would be bullish, signaling another test of 11600. A strong secondary correction, below 10700, however, would warn that the index may be entering a stage 3 top; a fall below 10200 would warn of a primary trend reversal; while a close below 10000 would confirm this.
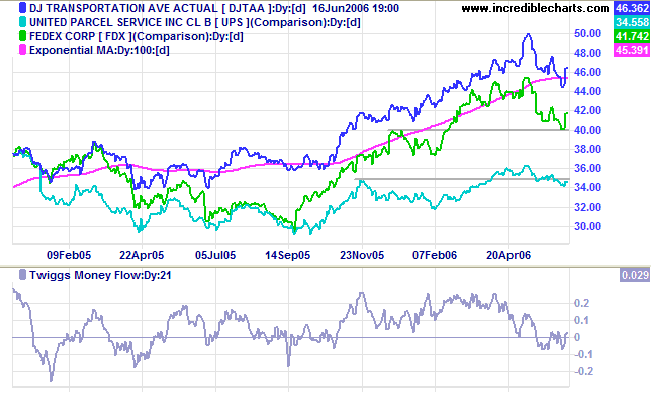
The Dow Jones Transportation Average recovered after a
brief dip below its 100-day
exponential moving average.
Twiggs Money Flow (21-day) whipsawing around the zero line
signals uncertainty and we may see a continuation of the
secondary correction on the transport index and lead indicators,
Fedex and UPS. However, all remain in primary up-trends.
The S&P 500 broke through support at 1250 on Monday,
before recovering with a large blue candle on Thursday.
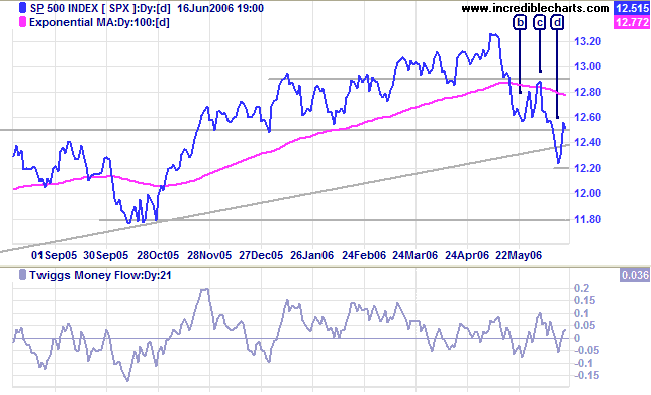
Medium Term: The show isn't over yet, and a fall below
1220 would signal a test of primary support at 1180. A rise above
1290, on the other hand, would signal that the secondary
correction has ended.
Twiggs Money Flow (21-day) whipsawing around the zero line
signals uncertainty.
Long Term: The S&P 500 is in a slow up-trend. A close below 1180 would signal a reversal.
Long Term: The S&P 500 is in a slow up-trend. A close below 1180 would signal a reversal.
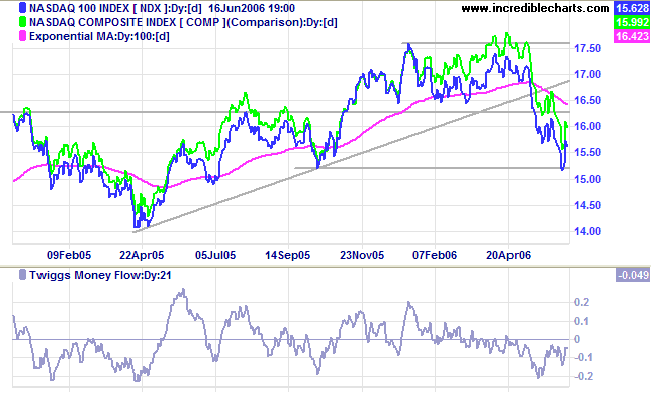
The Nasdaq 100 respected support at 1520, but
Twiggs Money Flow (21-day) remains below zero, signaling
strong
distribution. Expect another test of the support level. A
close below 1520 would mean a primary trend reversal, with
bearish implications for the Dow and S&P 500. A close above
1630, on the other hand, would complete a bullish double bottom,
signaling a test of the previous high at 1760.
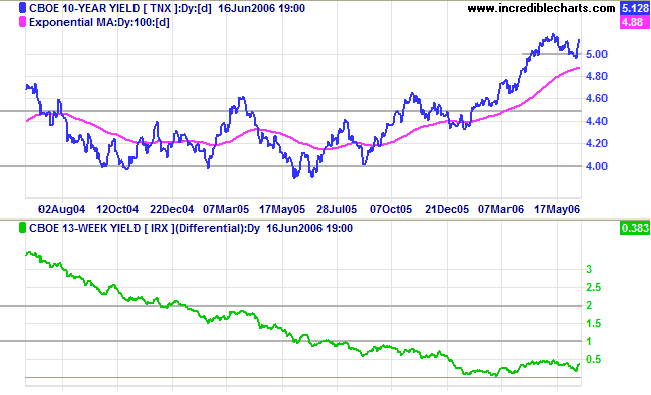
Treasury yields
After a false break below 5.0%, the 10-year treasury yield rallied strongly above the support level.
Medium Term: The Fed is likely to raise rates by another 0.25% at its June 28-29 meeting, ensuring that the 10-year yield will respect the 100-day exponential moving average and continue its recent up-trend.
Long Term: The yield differential (10-year T-notes minus 13-week T-bills) recovered slightly, but remains below 1%, leaving the economy vulnerable if short-term interest rates continue to rise.
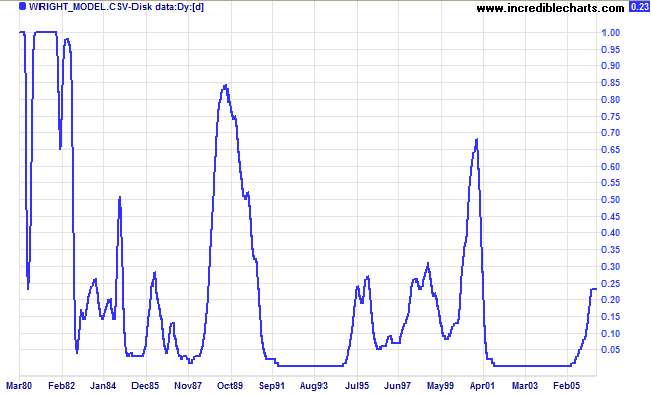
Wright Model
Developed by Fed economist Jonathan H Wright, the Wright Model combines the yield differential and fed funds rate to calculate the probability of recession. Looking ahead at the next four quarters, the probability remains at a modest 23%. The probability would increase if short-term rates rise or the yield differential falls.
Developed by Fed economist Jonathan H Wright, the Wright Model combines the yield differential and fed funds rate to calculate the probability of recession. Looking ahead at the next four quarters, the probability remains at a modest 23%. The probability would increase if short-term rates rise or the yield differential falls.
Gold
Spot gold broke through support at $600 and fell sharply before encountering primary support at $535.
Medium Term: Expect consolidation above primary support at $535. Dollar weakness would most likely lead to another gold rally.
Long Term: The gold-oil ratio is at a historically low level, below 9. Up-turns below 10 signal buying opportunities; down-turns above 20 indicate selling opportunities. Expect a recovery if crude oil prices remain high.
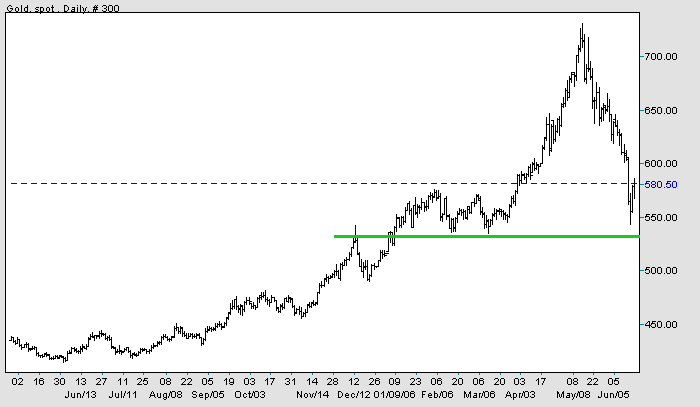
Source: Netdania
Crude Oil
Light Crude is testing intermediate support at $69. A fall below $69 would test primary support at $64. If price respects the descending trendline from [A] to [C], it would form a bearish descending triangle pattern. However, a rise above [C] would signal continuation of the rally and a test of resistance at $77.
Light Crude is testing intermediate support at $69. A fall below $69 would test primary support at $64. If price respects the descending trendline from [A] to [C], it would form a bearish descending triangle pattern. However, a rise above [C] would signal continuation of the rally and a test of resistance at $77.

Currencies
The dollar is strengthening in the short/medium-term after hawkish statements about inflation by senior Fed officials.
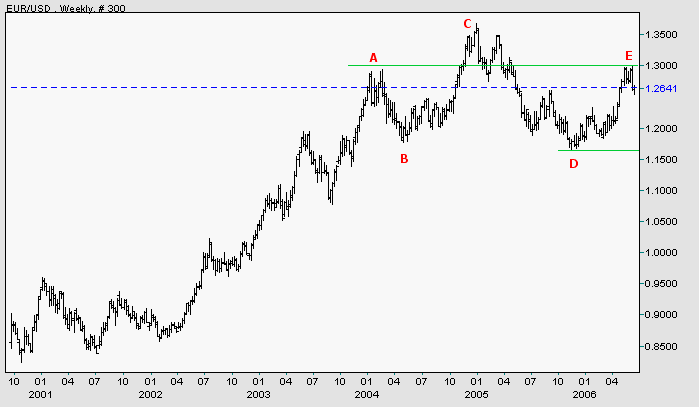
EUR/USD: The euro appears headed for a test of support at [D] after a break below the narrow rectangle formed at [E]. The euro remains in a primary up-trend; unless a fall below [D] completes a major head and shoulders reversal (with a target of 0.96: 1.16 - (1.36 - 1.16)). A reversal above [E], on the other hand, would test the previous high of [C].
The dollar is strengthening in the short/medium-term after hawkish statements about inflation by senior Fed officials.
EUR/USD: The euro appears headed for a test of support at [D] after a break below the narrow rectangle formed at [E]. The euro remains in a primary up-trend; unless a fall below [D] completes a major head and shoulders reversal (with a target of 0.96: 1.16 - (1.36 - 1.16)). A reversal above [E], on the other hand, would test the previous high of [C].
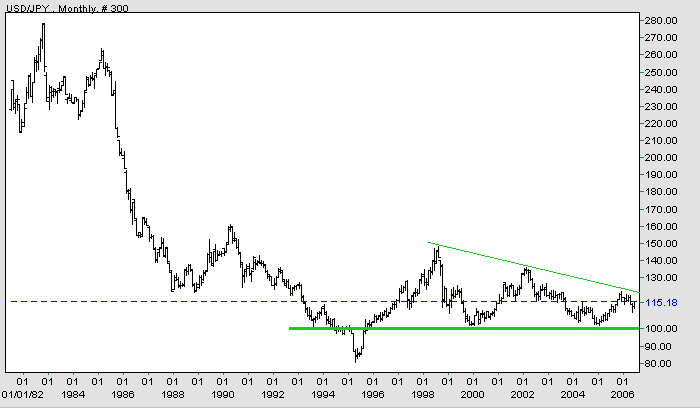
USD/JPY: It is always useful to view the big picture in order to
put current price moves into perspective. The dollar has been
weakening against the yen for the last 20 years, with major
support forming at 100 yen/dollar. The
descending triangle started in 1998 suggests further weakness
and a fall below 100 would be a strong bear signal for the
dollar. On the other hand, a rise above the January 2006 high of
121 would break the triangle pattern and signal a long-term trend
reversal.
Source: Netdania
United Kingdom
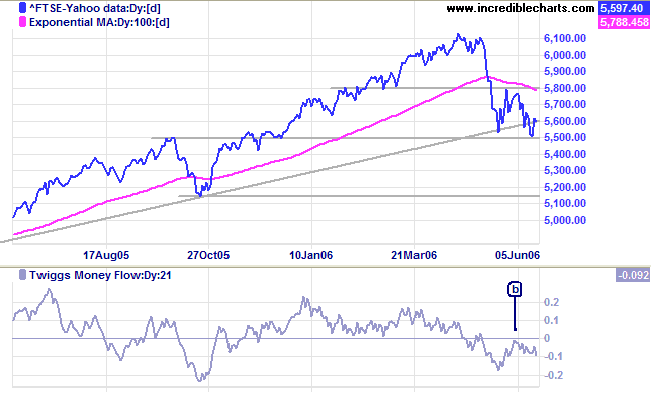
The FTSE 100 again tested support at 5500. The break of the long-term trendline warns that momentum is slowing.
Medium Term: A close below 5500 would signal a test of primary support at 5150, while a close above 5800 would complete a double bottom, signaling another test of 6100. The Twiggs Money Flow (21-day) peak below zero at [b] warns of strong distribution.
Long Term: The FTSE 100 remains in a primary up-trend.
Japan
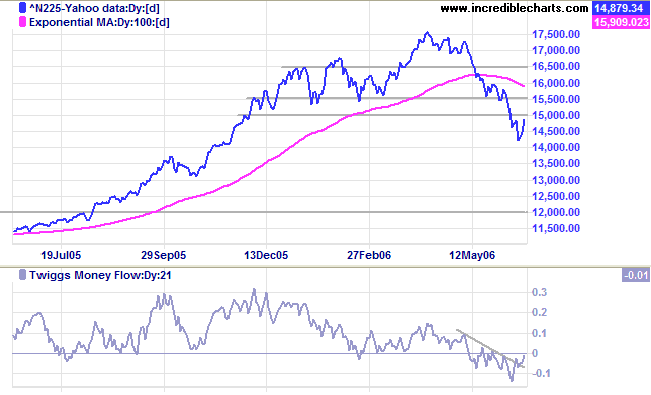
The Nikkei 225 is pulling back to test resistance at the former primary support level of 15000.
Medium Term: The index respecting resistance at 15000 would confirm the down-trend, while failure of the resistance level would warn of a bear trap. Twiggs Money Flow (21-day) reflects short-term accumulation, but remains below zero, signaling longer-term weakness.
Long Term: The index is in a primary down-trend. The next level of support is at 13000, with major support at 12000.
ASX Australia
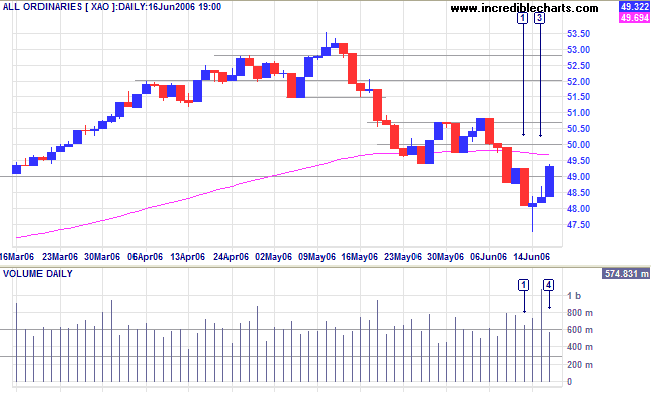
The All Ordinaries started the short trading week with a large red candle [1] overcoming buying support from the end of last week. A long tail at [2] signaled a resurgence of buying interest and was followed by massive volume at [3] as buying support met another surge of selling; price closed up on the previous day, but the tall shadow warned that the outcome was still in the balance. However, bolstered by a strong day on the Dow, buyers took control on Friday as selling pressure dissipated.
Expect some resistance at 4950 and further opposition at 5080. Bear in mind, however, that any sharp moves on the Dow are likely to follow through into the local market.
Medium Term: If the latest upswing respects the 100-day
exponential moving average, we are likely to see the
secondary correction test the lower border of the linear
regression channel. Conversely, a rise above 5080 would signal
the end of the secondary correction.
Twiggs Money Flow (21-day) is below zero, but edging upwards,
reflecting market indecision.
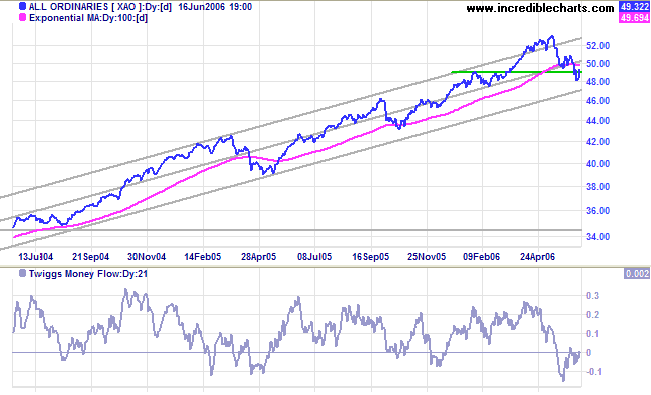
Long Term: The All Ordinaries remains in a primary
up-trend.
For further background information, read About
the Trading Diary.
Regards,
Regards,
Colin Twiggs
The financial markets generally are
unpredictable.
So that one has to have different scenarios...
The idea that you can actually predict what's going to happen
contradicts my way of looking at the market.
~ George Soros
So that one has to have different scenarios...
The idea that you can actually predict what's going to happen
contradicts my way of looking at the market.
~ George Soros