Trading Diary
May 6, 2006
These extracts from my daily trading diary are for educational
purposes and should not be interpreted as investment advice. Full
terms and conditions can be found at Terms
of Use.
USA
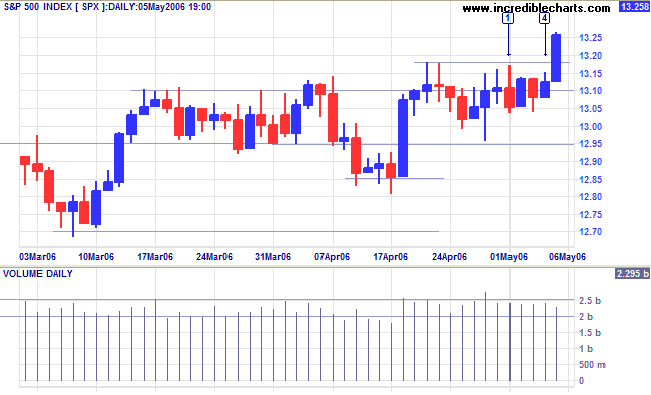
The S&P 500 broke out from the recent consolidation, the strong blue candle on Friday [5] signaling resumption of the primary up-trend. Look for a retracement that respects the new 1315/1320 support level -- to confirm the up-trend.
The S&P 500 broke out from the recent consolidation, the strong blue candle on Friday [5] signaling resumption of the primary up-trend. Look for a retracement that respects the new 1315/1320 support level -- to confirm the up-trend.
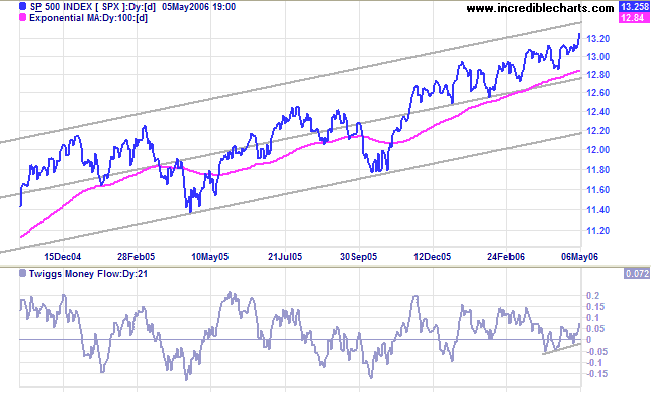
Medium Term: The index is rising towards the top of the
standard deviation channel (parallel lines are fitted at 2
standard deviations around a linear regression line). A break
above the upper channel would mean that the trend is
accelerating, while a close below the center line would signal a
secondary correction, testing support at the lower edge of the
channel.
Twiggs Money Flow (21-day) is trending upwards, signaling
accumulation.
Long Term: The index is in a slow primary up-trend, with support at 1180.
Long Term: The index is in a slow primary up-trend, with support at 1180.
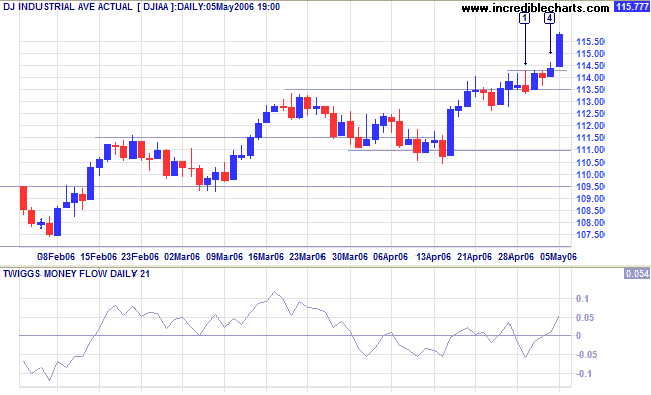
The Dow Industrial Average broke out of the narrow
consolidation above 11350, the weak close and strong volume
signaling resistance at [4], but overcome by a strong blue candle
on Friday.
Medium Term: Twiggs Money Flow (21-day) is rising, signaling accumulation. The latest primary up-swing is gaining momentum.
Long Term: The rise of more than 1.0% on Friday should dispel any doubts about the primary up-trend. Dow Theory confirms a bull market with both Industrial and Transport Averages in primary up-trends.
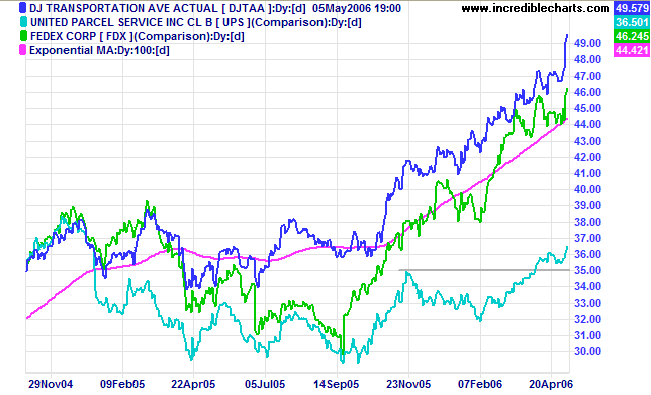
The Dow Jones Transportation Average and lead indicators,
Fedex and UPS, have all recovered strongly. The three indicators,
all in primary up-trends, remain a long-term bull signal for the
economy.
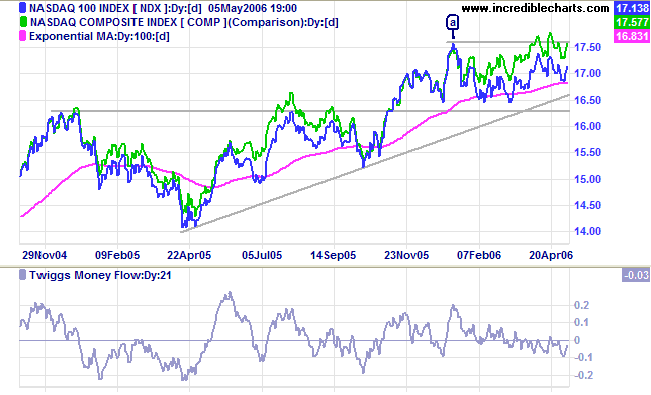
The Nasdaq 100 continues to consolidate between 1630 and
1760.
Twiggs Money Flow (21-day) is below zero, signaling
distribution -- so watch for a retracement to test the 1630
support level.
Treasury yields
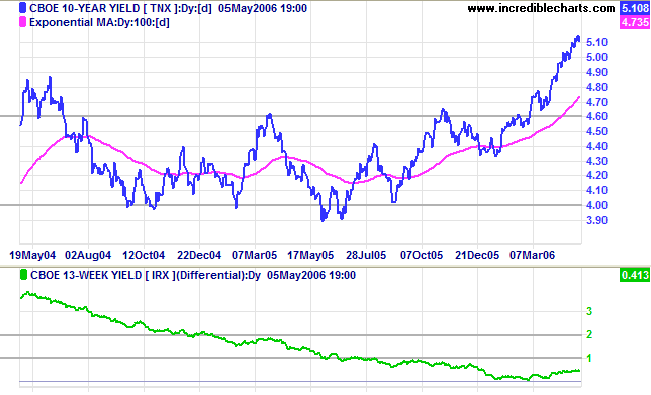
The 10-year treasury yield continues in a strong up-trend, aided by the decline of the dollar and the possibility of central banks diversifying their holdings into euros.
Medium Term: Chairman Bernanke's testimony before Congress hinted at a pause in future rate hikes. This is supported by lower than expected job growth figures for April. Expect rates to be raised another quarter point to 5.0% at the next Fed meeting, followed by a pause.
Long Term: The yield differential (10-year T-notes minus 13-week T-bills) is trending upwards. A low yield differential poses a significant threat to the economy when short-term interest rates are high.
Wright
Model: Developed recently by Fed economist Jonathan H
Wright, the model combines the yield differential and fed funds
rate to calculate the probability of recession. Looking ahead at
the next four quarters, the probability remains reasonably
low at 23%.
The Big Picture: Transport indicators signal
increasing economic activity and equity markets are improving. A
weakening dollar is likely to drive long-term interest rates
upwards, but could also boost export sales, offsetting the impact
of higher rates on equity markets. The Wright Model is positive,
allaying fears of an economic downturn, and we can expect a
growing economy over the next four quarters.
Gold
Speculators are driving the gold price higher, aided by the weakening dollar. The Friday New York close is $682.40.
Medium Term: An upward spike is identified by strong rallies and short retracements/consolidations lasting only a few days. They are exceedingly volatile, with strong gains followed by sharp retracements.
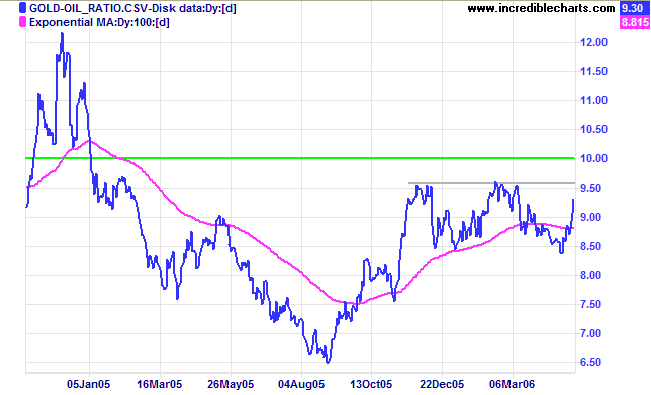
The Big Picture: The gold-oil ratio is trending upwards -- confirmed if there is a rise above 9.50. Up-turns below 10 normally signal good buying opportunities, while down-turns above 20 indicate selling opportunities. Expect further gains if crude oil remains above $70/barrel.
Speculators are driving the gold price higher, aided by the weakening dollar. The Friday New York close is $682.40.
Medium Term: An upward spike is identified by strong rallies and short retracements/consolidations lasting only a few days. They are exceedingly volatile, with strong gains followed by sharp retracements.
The Big Picture: The gold-oil ratio is trending upwards -- confirmed if there is a rise above 9.50. Up-turns below 10 normally signal good buying opportunities, while down-turns above 20 indicate selling opportunities. Expect further gains if crude oil remains above $70/barrel.
Data Source: Global
Financial Data
Crude Oil
Light Crude retraced to $70.19 to test the new $70 support level. A successful test would be a strong bull signal for gold and oil prices; as would a close above the recent high of $75/barrel. A close below $70 on the other hand would indicate weakness.
Light Crude retraced to $70.19 to test the new $70 support level. A successful test would be a strong bull signal for gold and oil prices; as would a close above the recent high of $75/barrel. A close below $70 on the other hand would indicate weakness.
Currencies
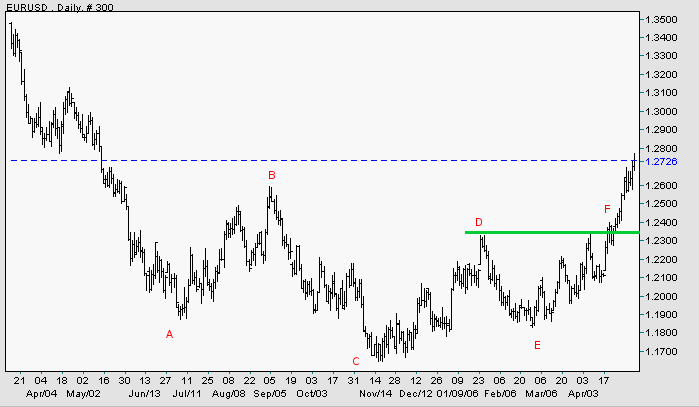
The dollar is weakening against major trading partners.
EUR/USD: The euro is in a strong up-trend against the dollar after breaking through resistance at [F].
The dollar is weakening against major trading partners.
EUR/USD: The euro is in a strong up-trend against the dollar after breaking through resistance at [F].
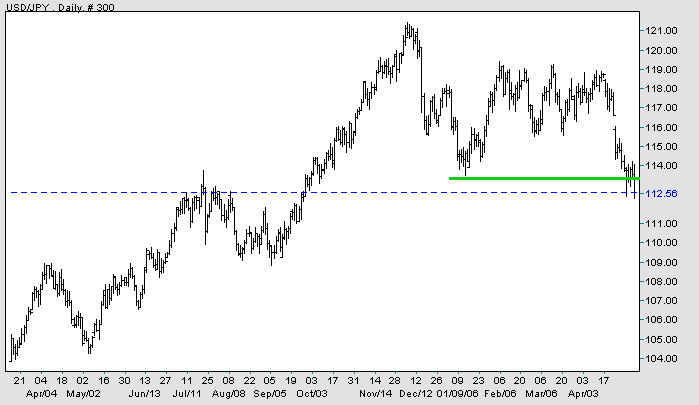
USD/JPY: The dollar broke through support and has commenced a
primary down-trend.
Source: Netdania
United Kingdom
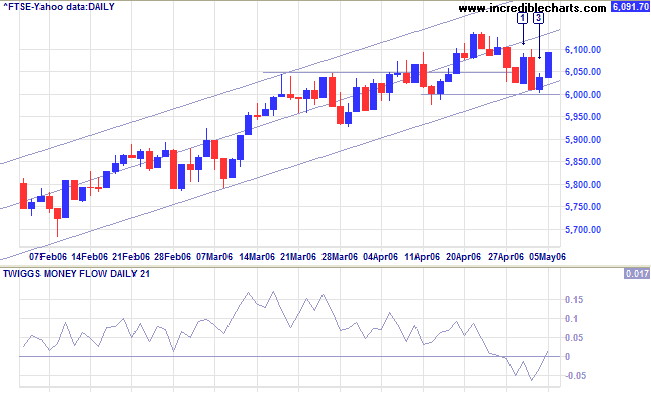
The FTSE 100 respected support at 6000, a strong bull signal.
Medium Term: Twiggs Money Flow (21-day) descended below zero, signaling distribution for most of the week, before recovering on Friday with the strong blue candle [4].
The Big Picture: The FTSE 100 is in a strong primary up-trend.
The FTSE 100 respected support at 6000, a strong bull signal.
Medium Term: Twiggs Money Flow (21-day) descended below zero, signaling distribution for most of the week, before recovering on Friday with the strong blue candle [4].
The Big Picture: The FTSE 100 is in a strong primary up-trend.
Japan
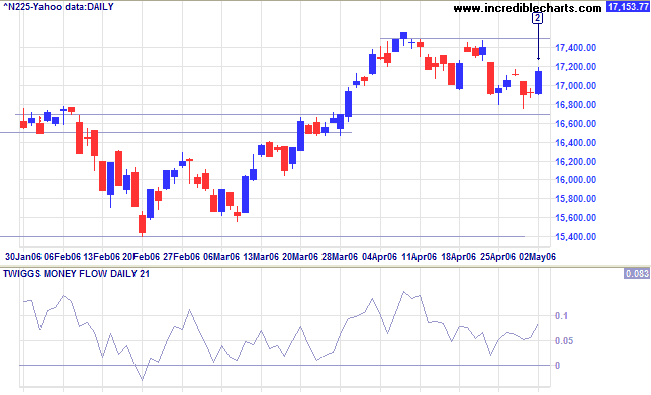
The Nikkei 225 closed a very short week, so far respecting the 16700/16800 support level.
Medium Term: Twiggs Money Flow (21-day) is rising while above zero, signaling short and long term accumulation. A break above 17500 would signal a test of the 17900 target (16700 + (16700 - 15500)), while a fall below 16700 would mean a secondary correction.
The Big Picture: The primary up-trend continues.
ASX Australia
After several days consolidation, the All Ordinaries broke through support at 5200 with a strong red candle at [4]; increased volume indicates the level of buying support. This turned into a false break, with a retreat above the former 5200 support level on Thursday. A close above 5280 would signal continuation of the primary up-trend, while a reversal below 5200 would be bearish -- and a close below the April 13 low of 5120 would confirm the start of a secondary correction.
After several days consolidation, the All Ordinaries broke through support at 5200 with a strong red candle at [4]; increased volume indicates the level of buying support. This turned into a false break, with a retreat above the former 5200 support level on Thursday. A close above 5280 would signal continuation of the primary up-trend, while a reversal below 5200 would be bearish -- and a close below the April 13 low of 5120 would confirm the start of a secondary correction.
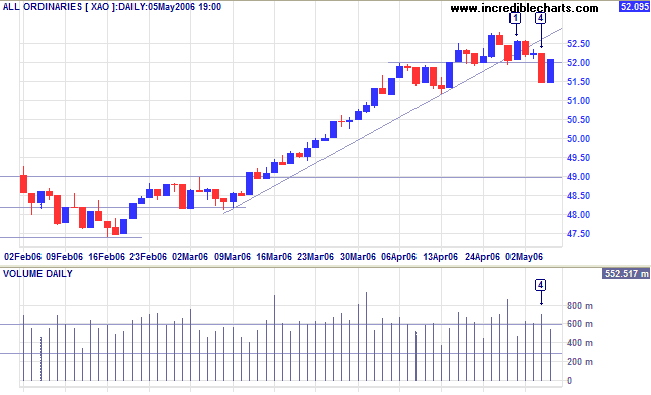
Medium Term: The up-trend has accelerated -- indicated by
the rise above the upper border of the linear regression channel.
Twiggs Money Flow (21-day) is well above zero, signaling
long-term trend strength, but the recent
divergence demonstrates short/medium-term weakness.
Accelerating trends make rapid gains, but often blow-off
into a sharp reversal.
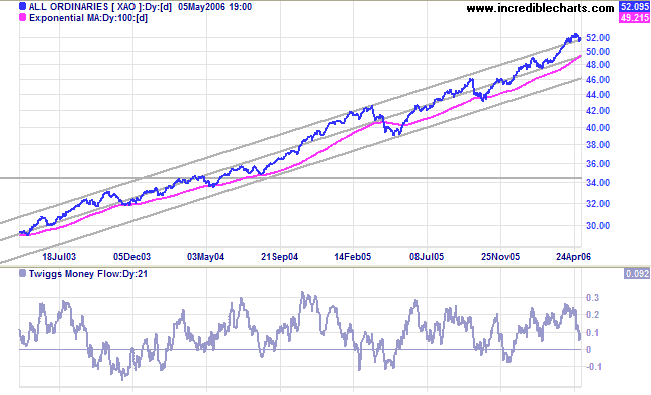
The Big Picture: The All Ordinaries remains in a strong
primary up-trend.
For further background information, read About
the Trading Diary.
Regards,
Regards,
Colin Twiggs
Luck is what happens when preparation meets opportunity.
~ Elmer Letterman
~ Elmer Letterman