Trading Diary
April 14, 2006
These extracts from my daily trading diary are
for educational purposes and should not be interpreted as
investment advice. Full terms and conditions can be found at
Terms
of Use.
USA
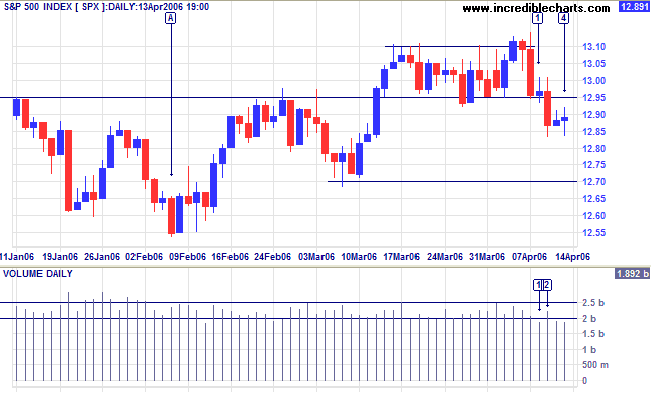
The S&P 500 fell through support at 1295 after several days of declining volume signaled a lack of interest from buyers. The market then drifted sideways for the next two days, with little interest shown ahead of the long weekend. A test of intermediate support at 1270 is likely, but a rise above 1295 would signal an early recovery.
As we approach mid-April, the chances of a March quarter-end correction are now easing.
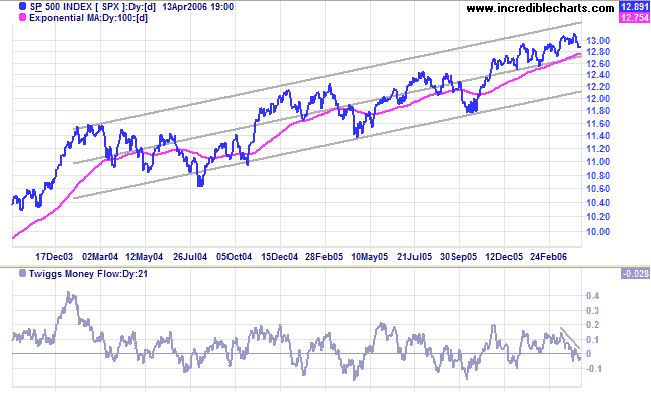
Medium Term: The S&P 500 is edging upwards in a narrow
band above the center line of a standard deviation channel
(parallel lines fitted at 2 standard deviations around a linear
regression line). A close below the center linear regression line
would signal a test of support at the lower edge of the channel.
Twiggs Money Flow below zero warns of distribution.
Long Term: The index is in a slow up-trend, with primary support at 1180.
Long Term: The index is in a slow up-trend, with primary support at 1180.
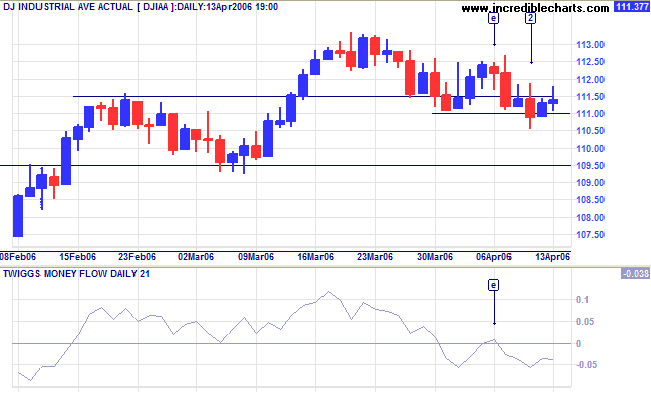
Having completed a lower high at [e] the Dow Industrial
Average was looking bearish last week, but the index appears
to have found support at 11100, with a long tail and increased
volume at [2].
Medium Term: Twiggs Money Flow (21-day) is still bearish, having completed a peak below zero at [e], but the false break on the price chart at [2] is a bullish sign, confirmed if we see a close above 11250.
Long Term: The index is edging upwards, in a slow primary up-trend.
Medium Term: Twiggs Money Flow (21-day) is still bearish, having completed a peak below zero at [e], but the false break on the price chart at [2] is a bullish sign, confirmed if we see a close above 11250.
Long Term: The index is edging upwards, in a slow primary up-trend.
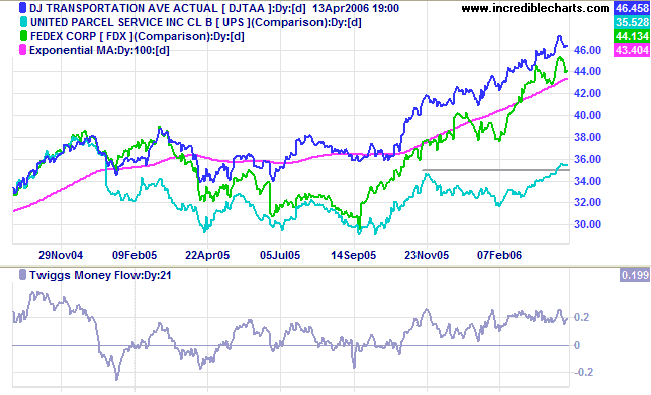
The Dow Jones Transportation Average and lead indicators
Fedex and UPS are in strong primary up-trends, signaling
increasing economic activity -- a bull signal for equity markets.
The strength of the DJTAA is best illustrated by Twiggs Money
Flow (21-Day) which has not crossed below zero in more than 5
months.
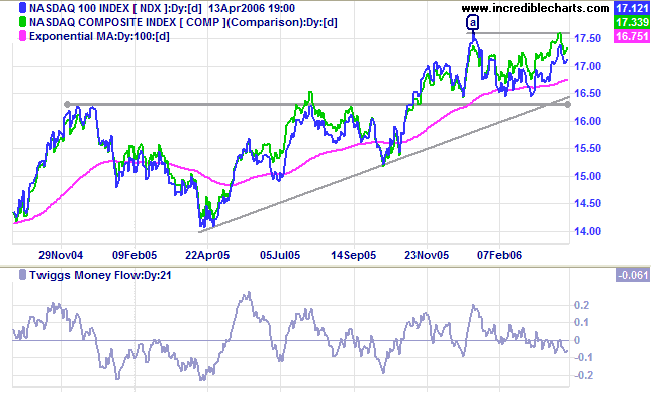
The Nasdaq 100 is headed for a test of resistance at 1760
and is expected to follow the broader Nasdaq Composite to
above its January high, signaling continuation of the primary
up-trend. However,
Twiggs Money Flow (21-day) is below zero, warning us to
exercise caution.
Treasury yields
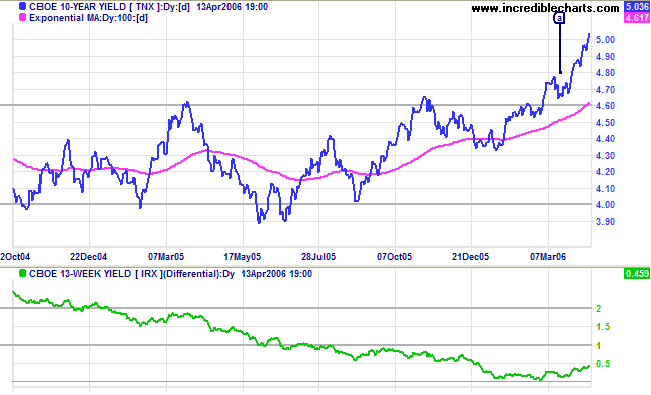
The 10-Year treasury yield climbed steeply to reach 5% for the first time in 4 years as rising yields in Japan and Europe attract investors away from the US.
Medium Term: The Fed is expected to continue hiking the short-term funds rate, causing long-term yields to rise further. The buoyant property market may slow but should not be significantly harmed by the historically low yields, while banks will benefit from wider margins caused by the steeper yield curve.
Long Term: The yield differential (10-year T-notes minus 13-week T-bills) is trending upwards, allowing the Fed more leeway to increase interest rates.
Wright's Model: Developed recently by Federal Reserve economist Jonathan H Wright, the model combines the yield differential and fed funds rate to predict the probability of recession. The probability looking ahead at the next four quarters is reasonably low at 23%.
The Big Picture: Transport indicators are bullish, while
equity markets edge cautiously upwards. Expect rate hikes to
continue for the next few months and long-term yields to rise --
without causing significant harm to the economy because of the
historically low levels. The improving
yield differential is a positive sign, allaying fears of an
economic downturn, and the signs are good for a growing economy
over the next four quarters.
Gold
Spot gold is testing resistance at $600, closing the week at $596.30.
Medium Term: Narrow consolidation below $600 is a bullish sign, signaling continuation.
The Big Picture: Gold is in a primary up-trend. The previous high of $850 was experienced during the 1980 Iran/Iraq crisis at which time crude oil climbed to the dizzy height of $38/barrel. If we had an identical crisis today, adjusting 1980 prices for inflation, oil would be close to $100/barrel and gold trading above $2000!
Crude Oil
Light Crude is currently $69.50/barrel, testing resistance at $70. A rise above $70 would be a strong bull signal for oil (and gold) prices, while a drop below $55 would signal a primary trend reversal.
Light Crude is currently $69.50/barrel, testing resistance at $70. A rise above $70 would be a strong bull signal for oil (and gold) prices, while a drop below $55 would signal a primary trend reversal.
Currencies
Nothing much has changed in the last week: the dollar continues to consolidate in a narrow range against major trading partners.
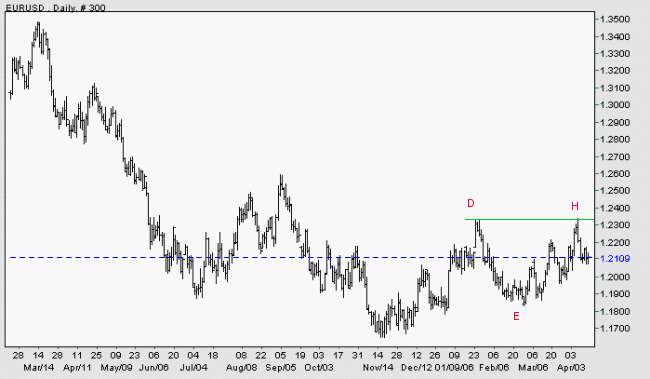
EUR/USD: The euro is in an intermediate up-trend and threatens a primary trend reversal (after the recent bullish breakout from a large triangle). A rise above the high of [D] would confirm that the euro has started a primary up-trend against the dollar, while a fall below [E] would signal continuation of the down-trend.
Nothing much has changed in the last week: the dollar continues to consolidate in a narrow range against major trading partners.
EUR/USD: The euro is in an intermediate up-trend and threatens a primary trend reversal (after the recent bullish breakout from a large triangle). A rise above the high of [D] would confirm that the euro has started a primary up-trend against the dollar, while a fall below [E] would signal continuation of the down-trend.
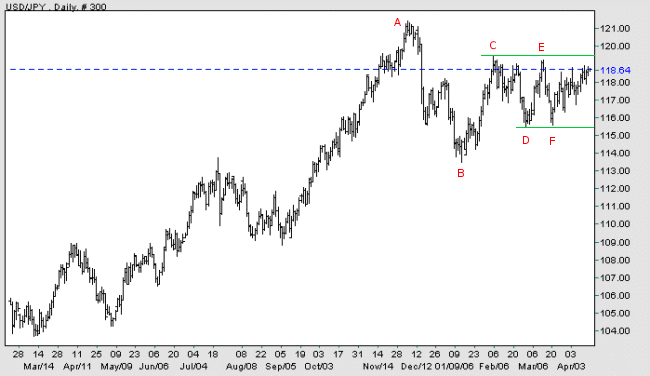
USD/JPY: The dollar consolidates in a narrow band against the
yen. A break above resistance at [C] would be a bullish sign,
while a fall below support at [F] would be bearish. In the
long-term, a rise above [A] would signal continuation of the
primary up-trend, while a fall below [B] would signal a reversal.
Source: Netdania
United Kingdom
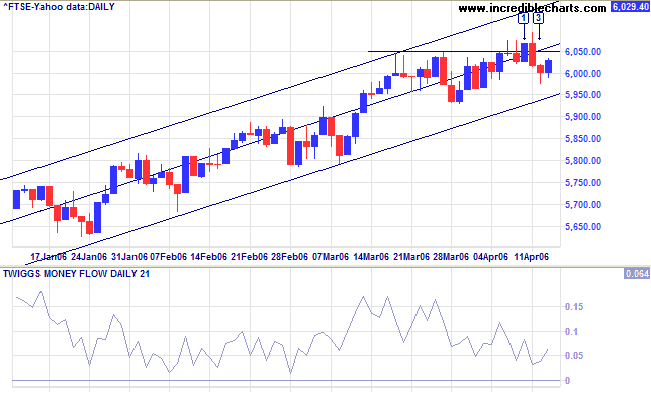
The FTSE 100 made a false breakout at [1], before increased volume signaled resistance and the index retreated below 6050 at [2]. However, a long tail at [3] signals buying support and possibly a further test of resistance; the short retracement being a bullish sign.
Medium Term: Twiggs Money Flow (21-day) continues to decline, warning of short-term distribution. A close back above 6050 would signal continuation of the up-trend, while an unlikely close below 5930 would signal a secondary correction.
The Big Picture: The FTSE 100 is in a strong primary up-trend.
Japan
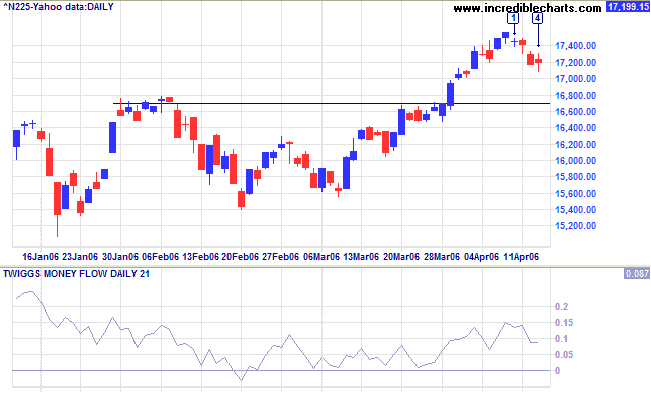
The Nikkei 225 retraced to test support, with weak closes at [1], [3] and [4] indicating a lack of commitment from sellers.
Medium Term: Twiggs Money Flow (21-day) is rising, signaling accumulation. If the current retracement respects support at 16700, expect a rally to test the target of 17900 (16700 + (16700 - 15500)).
The Big Picture: The index is in a strong primary up-trend.
ASX Australia
The All Ordinaries encountered resistance at 5200, an attempted rally on day [2] meeting with committed selling -- signaled by the high volume at [2] and [3]. The doji candle at [4], however, indicates indecision. A fall below the low of [4] would signal a correction, while a narrow consolidation between 5120 and 5200 would be a bullish (continuation) sign.
The All Ordinaries encountered resistance at 5200, an attempted rally on day [2] meeting with committed selling -- signaled by the high volume at [2] and [3]. The doji candle at [4], however, indicates indecision. A fall below the low of [4] would signal a correction, while a narrow consolidation between 5120 and 5200 would be a bullish (continuation) sign.
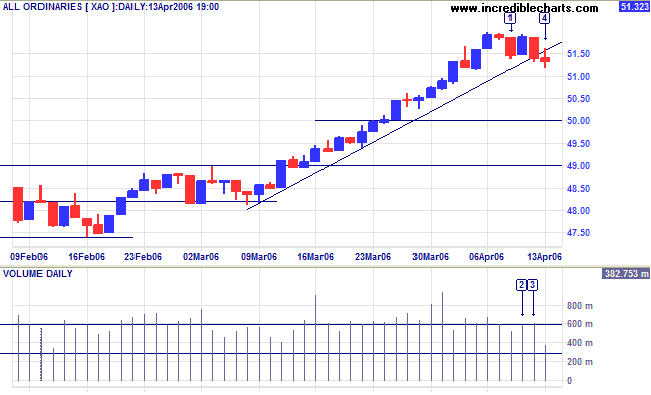
Medium Term:
Twiggs Money Flow (21-day) is rising well above zero,
signaling strong accumulation. The break above the upper border
of the linear regression channel indicates an accelerating trend.
This could develop into a blow-off, with rapid gains followed by
a sharp reversal as the index retreats to the safety of the
previous base (around 4800/4900). Cautious traders respond to
increased volatility by tightening their stops to protect
profits.
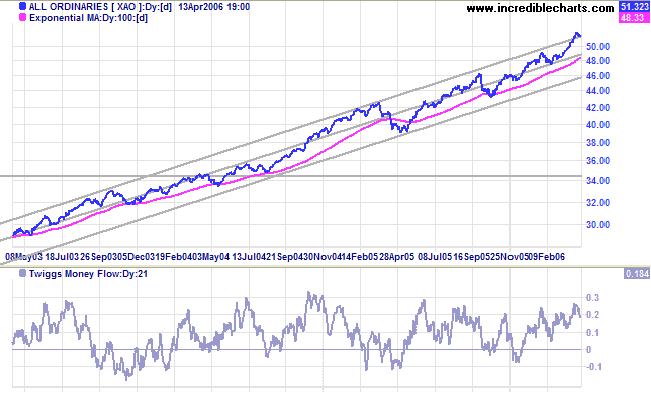
The Big Picture: The primary up-trend is accelerating.
For further background information, read About
the Trading Diary.
Regards,
Regards,
Colin Twiggs
Conditions are never just right.
People who delay action until all factors are favorable do nothing.
~ William Feather
People who delay action until all factors are favorable do nothing.
~ William Feather