Trading Diary
February 4, 2006
These extracts from my daily trading diary are
for educational purposes and should not be interpreted as
investment advice. Full terms and conditions can be found at
Terms
of Use.
USA
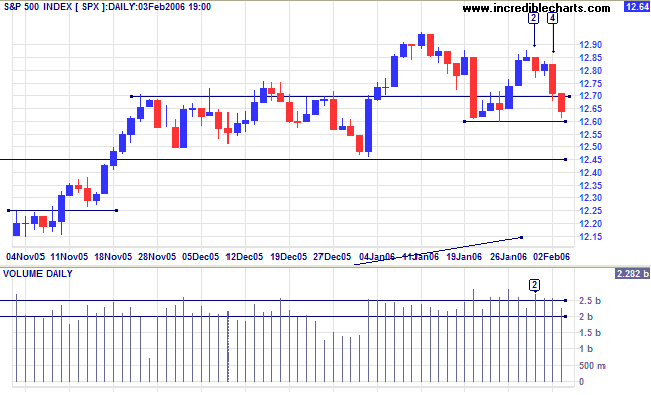
A lower high at [2] on the S&P 500 is an intermediate bear signal; though there is evidence of buying support (a long tail and strong volume) at [2]. Further long tails at [4] and [5] indicate continued buying and the index may encounter strong support at 1260 and 1245.
A lower high at [2] on the S&P 500 is an intermediate bear signal; though there is evidence of buying support (a long tail and strong volume) at [2]. Further long tails at [4] and [5] indicate continued buying and the index may encounter strong support at 1260 and 1245.
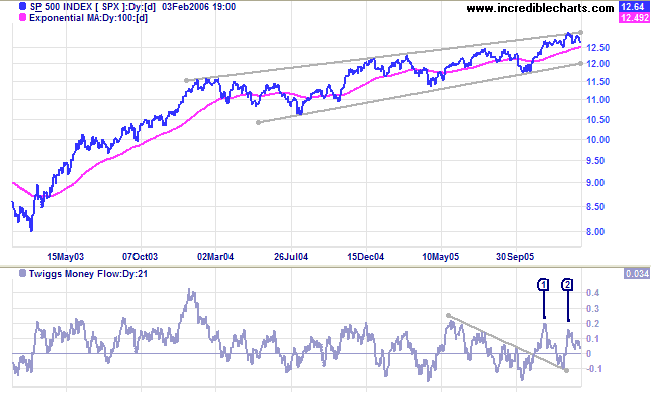
In the longer-term the index continues to consolidate in a narrow
range below the upper border of the long-term bearish
rising wedge pattern. An upward breakout from the pattern
would signal acceleration of the primary up-trend. A downward
breakout, on the other hand, would signal a trend reversal.
Twiggs Money Flow (21-day) is headed for a test of the zero
line after a lower high at [2] signals uncertainty.
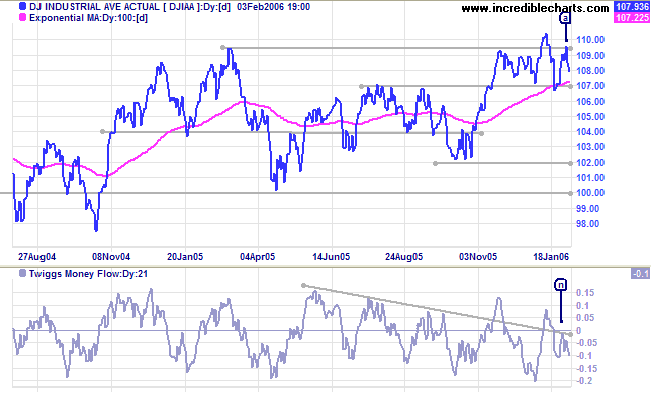
The Dow Industrial Average remains in a narrow
consolidation between 10950 and 10700, respecting resistance at
[a]. The location of the pattern, immediately below primary
resistance at 11000, is a long-term bull signal. In the
intermediate term, however,
Twiggs Money Flow (21-day) displays a bear signal with a
lower peak at [n], below the zero line.
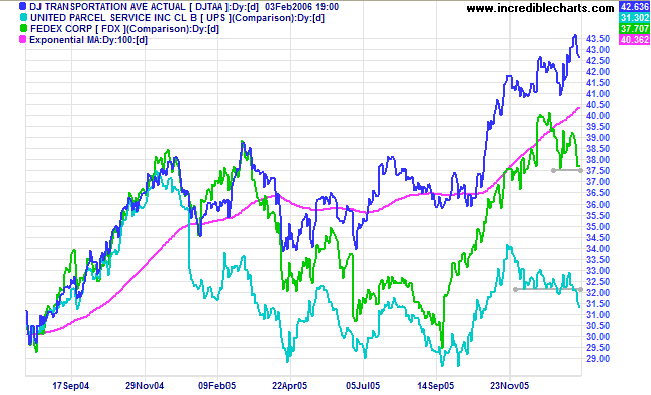
The Dow Jones Transportation Average continues in a
primary up-trend, but Fedex has lost momentum and UPS, the other
lead indicator, has reversed into a down-trend.
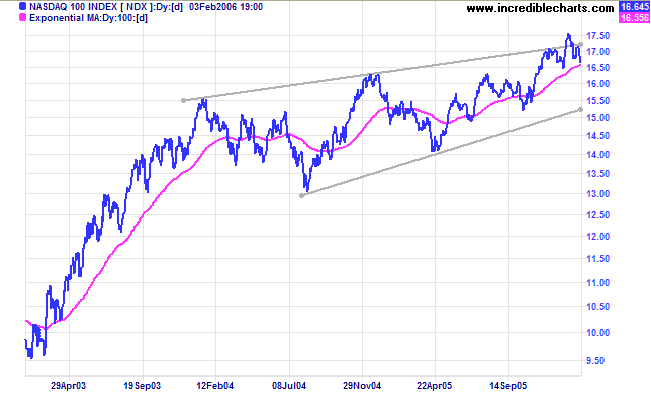
While the Nasdaq Composite is above the upper border of
the long-term bearish
rising wedge pattern, the narrower Nasdaq 100 has
retreated to within the wedge pattern. Conflicting signals do not
carry as much weight as when the two indexes confirm each other.
Twiggs Money Flow (21-day) is headed for a test of the zero
line; signaling accumulation if it respects the line.
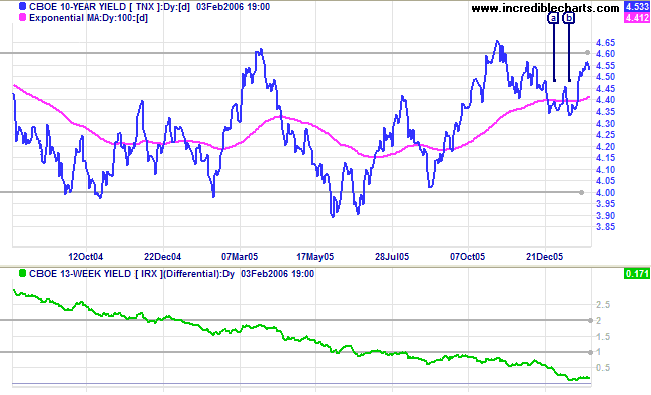
Treasury yields
Lower unemployment figures are likely to fuel inflationary pressures, with the Fed continuing to hike short-term interest rates. If long-term yields do not respond, we can expect a negative yield curve: a leading indicator of economic down-turns. However, the 10-Year treasury yield is testing resistance at 4.60% after a bullish short retracement (with a double bottom at [a] and [b]). A break through resistance would strengthen the weak yield differential (10-year T-notes minus 13-week T-bills), but rising long-term yields would cool the property market with a likely domino effect on the rest of the economy; not an easy start for the new Fed chairman.
Lower unemployment figures are likely to fuel inflationary pressures, with the Fed continuing to hike short-term interest rates. If long-term yields do not respond, we can expect a negative yield curve: a leading indicator of economic down-turns. However, the 10-Year treasury yield is testing resistance at 4.60% after a bullish short retracement (with a double bottom at [a] and [b]). A break through resistance would strengthen the weak yield differential (10-year T-notes minus 13-week T-bills), but rising long-term yields would cool the property market with a likely domino effect on the rest of the economy; not an easy start for the new Fed chairman.
The Big Picture: The S&P500 is in a long-term rising
wedge pattern while the Dow remains range-bound between 10000 and
11000 and the Nasdaq indexes give conflicting signals. The Dow
Transport index continues a primary up-trend, while the Fedex and
UPS lead indicators display weakness. The Fed is likely to
continue short-term rate hikes because of inflation fears. There
is not much good news and equity markets are expected to remain
sluggish.
Gold
New York: Spot gold is edging upwards, closing at $567.10 on Friday. The first line of primary support rests at $540 (the December peak) while intermediate support is at $560, the upper border of the January consolidation. Narrow consolidations normally resolve in the direction of the primary trend. The primary target {540 + (540 - 500)} and the intermediate target {560 + (560 - 540)} both coincide at $580.
The Big Picture: Gold is in a primary up-trend, signaling US dollar weakness.
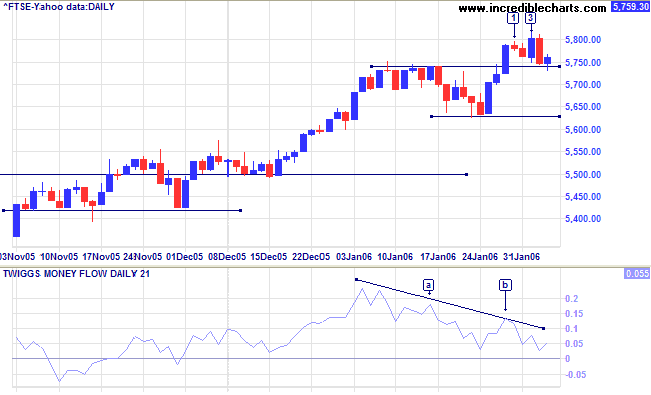
United Kingdom
The FTSE 100 appears weighed down by short-term bearish sentiment in US equity markets, with marginal new highs at [1] and [3]. Respecting support at 5750 would be a bullish sign, while a close below support at 5630 would be bearish. Lower highs on Twiggs Money Flow (21-day) at [a] and [b] signal distribution; and the indicator is again testing the zero line.
The Big Picture: The primary trend is up, with a target of 5860 {5500 + (5500 - 5140)}.
Japan
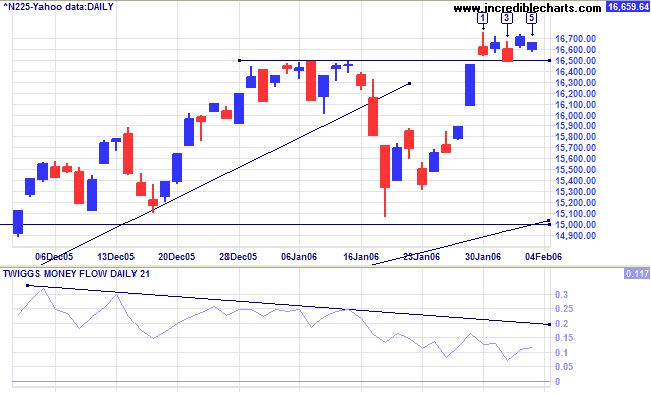
The Nikkei 225 broke through resistance at 16400/16500 and is consolidating in a narrow band above the new support level. The pattern favors an upside breakout as major resistance (at 16500) has already been overcome. Twiggs Money Flow (21-day) is declining, signaling intermediate-term weakness, but remains above the zero line at [a], indicating a long-term positive outcome.
The Big Picture: The Nikkei is in a strong primary up-trend with a target of 17500 { 16400 + (16400 - 15300)}.
ASX Australia
The All Ordinaries consolidated below resistance at 4900 for a few days before an attempted breakout at [4]. The breakout met strong resistance; signaled by the tall shadow and increased volume. The long tail at [5] signals support at 4820 (the January 17 high). If this first level of support holds, that would signal a possible test of 5000. A close below 4730, on the other hand, would signal a test of primary support at 4620/4300.
The All Ordinaries consolidated below resistance at 4900 for a few days before an attempted breakout at [4]. The breakout met strong resistance; signaled by the tall shadow and increased volume. The long tail at [5] signals support at 4820 (the January 17 high). If this first level of support holds, that would signal a possible test of 5000. A close below 4730, on the other hand, would signal a test of primary support at 4620/4300.
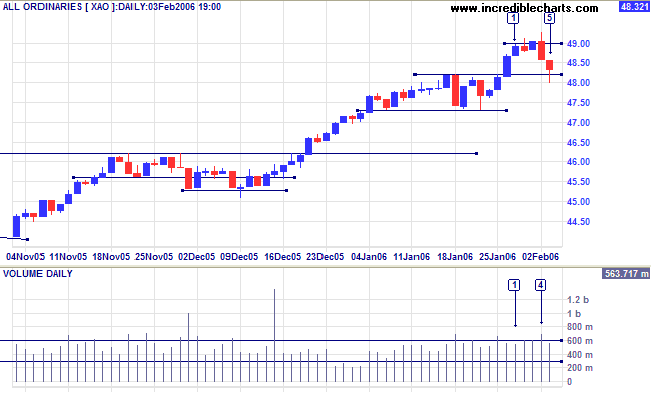
Twiggs Money Flow (21-day) is rising after consolidation
above the zero line at [A]. A trough that respects the zero line
would be a further bull signal.
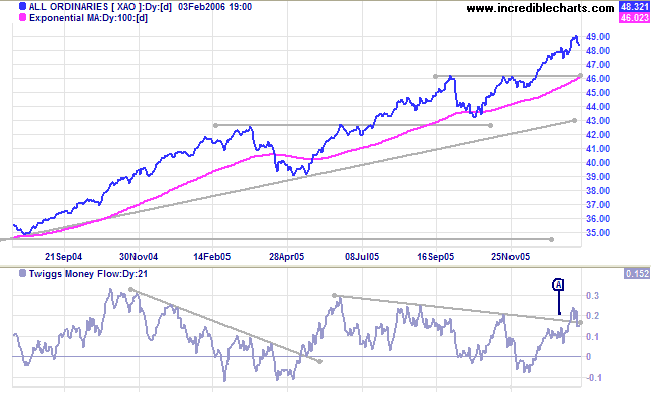
The Big Picture: The index is in a strong primary up-trend; fast approaching its target of 4940 {4620 + (4620 - 4300)}.
The Big Picture: The index is in a strong primary up-trend; fast approaching its target of 4940 {4620 + (4620 - 4300)}.
For further background information, read About
the Trading Diary.
Regards,
Regards,
Colin Twiggs
To laugh often and much;
to win the respect of intelligent people
and the affection of children;
to earn the appreciation of honest critics
and endure the betrayal of false friends.
To appreciate beauty;
to find the best in others;
to leave the world a bit better
whether by a healthy child,
a garden patch or
a redeemed social condition;
to know that even one life has breathed easier
because you have lived.
This is to have succeeded.
~ Ralph Waldo Emerson (1803 - 1882)