Trading Diary
July 16, 2005
These extracts from my daily trading diary are
for educational purposes and should not be interpreted as
investment advice. Full terms and conditions can be found at
Terms
of Use.
USA
The Dow Industrial Average hesitated at resistance at 10650 on Friday. The narrow range [5] and lower volume indicate that there is likely to be an upward breakout.
The Dow Industrial Average hesitated at resistance at 10650 on Friday. The narrow range [5] and lower volume indicate that there is likely to be an upward breakout.
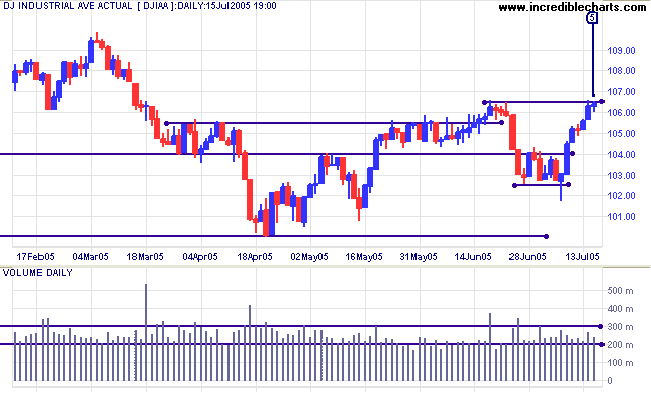
Twiggs Money Flow (100-day) has made a higher low and crossed
above the signal line, signaling increased buying.
Expect a test of primary resistance at 10950/11000. Primary support is at 10000.
Bullish developments on the S&P 500 or NASDAQ increase the possibility of an upside breakout, but we should not underestimate the strength of resistance at 11000. The most likely scenario is that the Dow continues to range between 10000 and 11000 for some time.
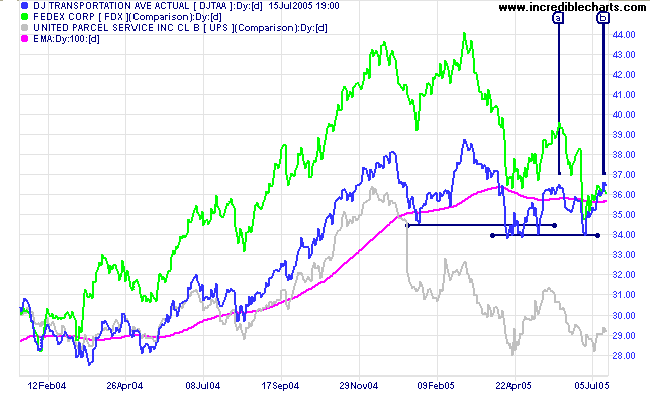
The Dow Jones Transportation Average continues to rise. A
double top at [a] and [b] would be a bear signal, but the index
appears more likely to break through resistance at 3650,
signaling resumption of the primary up-trend.
Fedex and UPS are both in down-trends, though UPS shows signs of weakening.
Fedex and UPS are both in down-trends, though UPS shows signs of weakening.
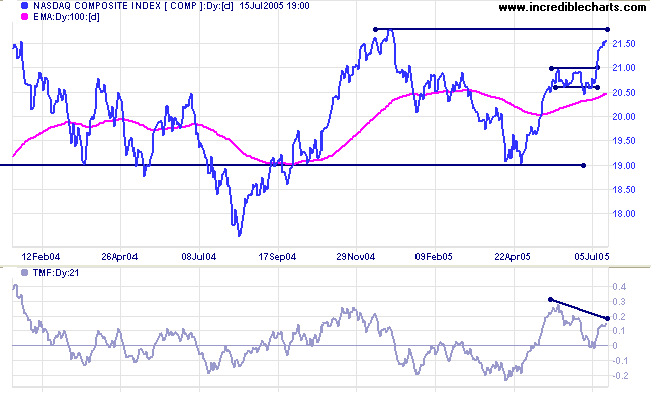
The Nasdaq Composite is headed for a test of resistance at
2180. A close above 2180 would break out from an 18-month bullish
ascending triangle, with a target of 2550: 2150 + (2150 -
1750).
The bearish divergence on Twiggs Money Flow (21-days) is at odds with the above; so exercise caution.
A fall below 1900 would be a long-term bear signal.
The bearish divergence on Twiggs Money Flow (21-days) is at odds with the above; so exercise caution.
A fall below 1900 would be a long-term bear signal.
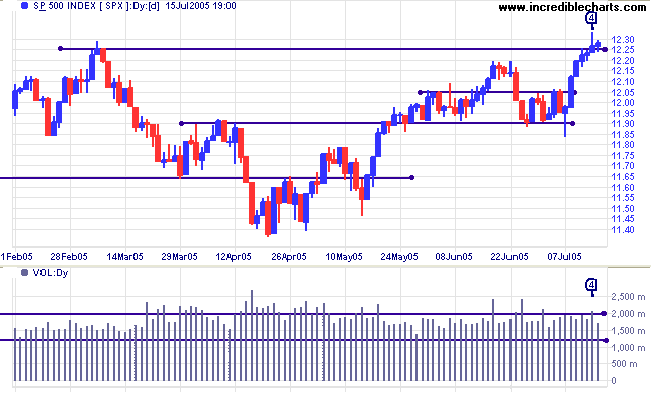
The S&P 500 closed at a new 3-year high on Friday,
signaling that the primary up-trend has resumed. This could still
be a marginal break, however, with the tall shadow and strong
volume at [4] signaling resistance. A rise above the high of [4]
would dispel this.
Remember that there are still two longer-term negatives: the (intermediate) bearish divergence on Twiggs Money Flow (21-day), signaling distribution, and the bearish rising wedge pattern formed over the last 18 months; so exercise caution.
Remember that there are still two longer-term negatives: the (intermediate) bearish divergence on Twiggs Money Flow (21-day), signaling distribution, and the bearish rising wedge pattern formed over the last 18 months; so exercise caution.
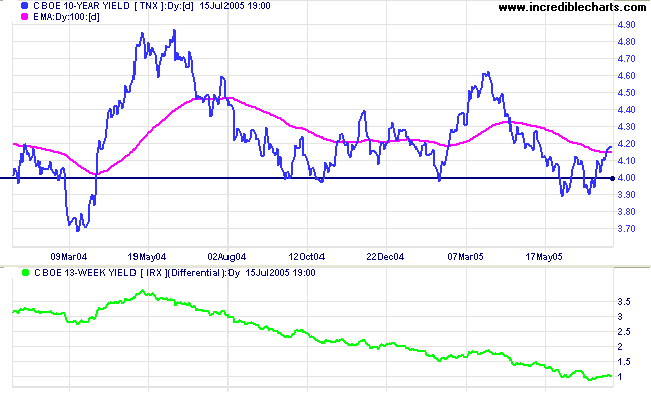
Treasury yields
The yield on 10-year treasury notes completed a small double bottom; signaling that a test of resistance at 4.60% is likely. Rising long-term yields would be a positive sign for equities.
The yield differential (10-year T-notes minus 13-week T-bills) at 1.0% warns of a potential inverted yield curve.
Inflation is the key. If the Fed's strategy of measured rates increases succeeds in containing inflation, they may be able to slow the pace of future increases. A rise in inflation, on the other hand, while driving up long-term yields, would also force the Fed to continue hiking interest rates; increasing the chances of an inverted yield curve (or negative yield differential).
Gold
New York: Spot gold closed lower at $420.50 and we can expect a test of intermediate support at $415.
Primary support is at $410; a fall below this level would be a long-term bear signal.
New York: Spot gold closed lower at $420.50 and we can expect a test of intermediate support at $415.
Primary support is at $410; a fall below this level would be a long-term bear signal.
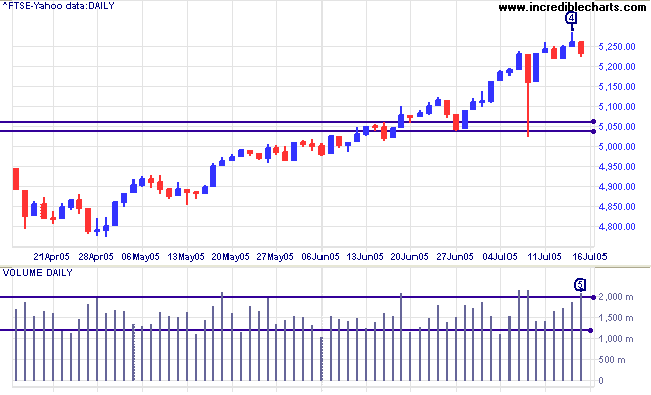
United Kingdom
The FTSE 100 is in a strong primary up-trend but the tall shadow on Thursday [4] and increasing volume [5] could signal the start of a secondary correction, likely to test the band of support at 5040/5060 (the February high).
The FTSE 100 is in a strong primary up-trend but the tall shadow on Thursday [4] and increasing volume [5] could signal the start of a secondary correction, likely to test the band of support at 5040/5060 (the February high).
The latest version of Incredible Charts allows users to import
data from a third party - Yahoo.com.
The beta version can be downloaded for testing at https://forum.incrediblecharts.com/messages/104/535138.html.
The beta version can be downloaded for testing at https://forum.incrediblecharts.com/messages/104/535138.html.
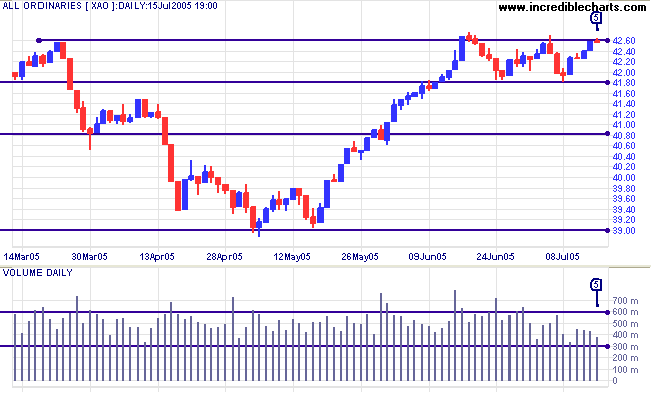
ASX Australia
The All Ordinaries has still not given a clear direction, but consolidation in a narrow band below resistance at 4260/4275 is a bullish sign. Based on the narrow consolidation, eventual breakout above resistance at 4260/4275 is more likely than failure of support at 4180 (with a subsequent test of 3900).
The narrow range and declining volume at [5] signals hesitancy from both buyers and sellers but is not particularly bearish. Expect the All Ords to follow the mood of US markets in the week ahead.
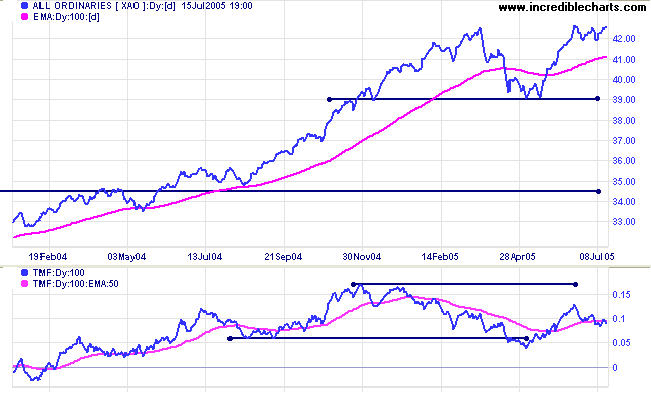
Twiggs Money Flow (100-day) displays long- and
intermediate-term bearish divergences below, at odds with the
bullish chart pattern (above); so it is advisable to adopt a
wait-and-see attitude.
A breakout above 4260, followed by a pull-back that respects the new support level, would signal further gains. The target would be 4620 (4260 + (4260 - 3900)). A fall below 3900, on the other hand, would complete a double top formation, signaling that a test of 3450 is likely.
A breakout above 4260, followed by a pull-back that respects the new support level, would signal further gains. The target would be 4620 (4260 + (4260 - 3900)). A fall below 3900, on the other hand, would complete a double top formation, signaling that a test of 3450 is likely.
For further assistance, read About
the Trading Diary.
Colin Twiggs
An appeaser is one who feeds a crocodile - hoping it will eat him
last.
- Winston Churchill
- Winston Churchill
Back Issues
Access the Trading Diary Archives.