Trading Diary
June 25, 2005
These extracts from my daily trading diary are
for educational purposes and should not be interpreted as
investment advice. Full terms and conditions can be found at
Terms
of Use.
USA
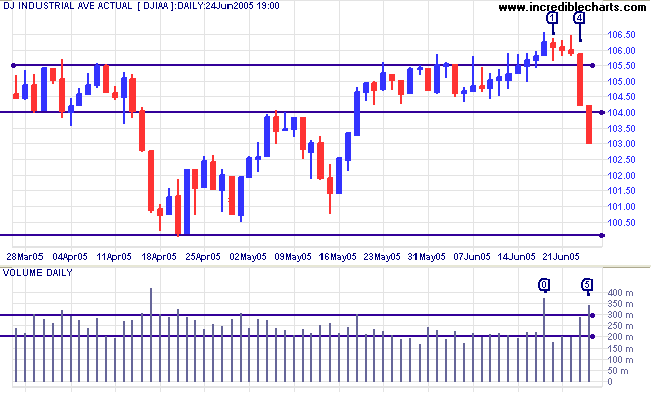
The Dow Industrial Average corrected sharply on strong volume and appears headed for a test of support at 10000. After increased selling last Friday, at [0], the index consolidated in a small pennant for 3 days before falling through resistance at 10550 on day [4]. Strong red candles and rising volume indicate an increasing element of fear: it took two days to reverse all gains made since May 18th.
Twiggs Money Flow (21-day) also formed a bearish divergence, similar to the Nasdaq and S&P 500.
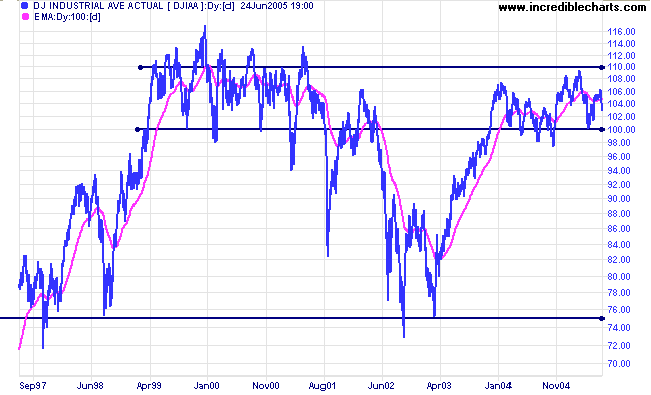
When we look at the larger time frame, we can see that price is
ranging between 10000 and 11000. The last year established strong
support at 10000/9750 and there is strong resistance at
11000/11500, shown by price action from 1999 to 2001 and by
recent highs in 2005.
The latest sharp correction is likely to encounter buying support at 10000. If that is brushed aside, we will see the development of a strong primary down-trend, possibly testing support at 7500. Confirmation could be provided by a pull-back that respects resistance at 10000 or by a fall below 9750, the October 2004 low.
On the other hand, if we see strong buying support at 10000, with the index respecting support accompanied by strong volume (or making a false break that is quickly recovered), expect another test of resistance at 11000.
The index is building a broad base, as with the top of 1999 to 2001. Volatility is significantly lower, however, with fewer wide swings from above 11000 to below 10000 and vice versa. An eventual upside breakout cannot be dismissed but chances are decreasing with the declining yield on treasury bonds (see Treasury Yields below).
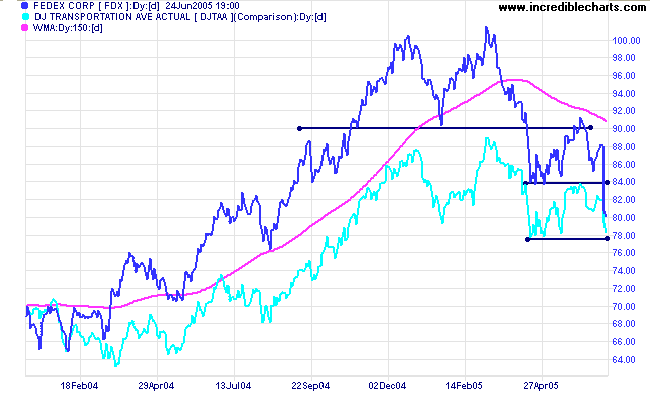
Transport indicators fell sharply in the past week. Fedex
confirmed that it is in a strong primary down-trend, with a fall
below 84.00, and appears to be dragging the Dow Jones
Transportation Average down with it. A DJTAA close below the
April low would be a strong bear signal.
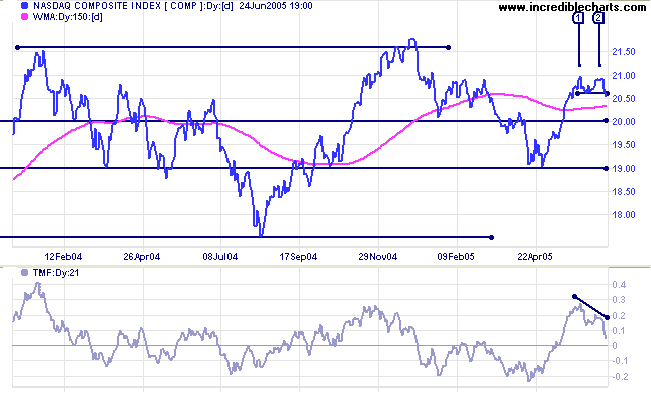
The Nasdaq Composite formed equal highs in the
intermediate up-trend, at [1] and [2]. On their own, equal highs
do not present a high probability of the trend reversing, but the
index has now completed a narrow double
top, with a fall below the intervening trough, and
Twiggs Money Flow (21-days) formed a bearish
divergence with a lower second peak. Expect a test of support
at 1900.
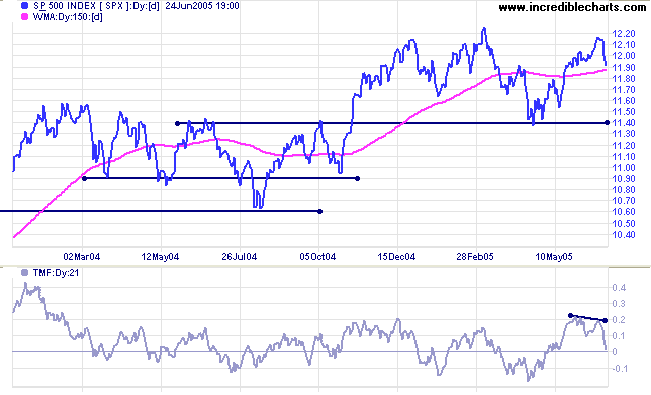
The S&P 500 reversed at resistance at the March high,
with
Twiggs Money Flow (21-days) displaying a strong
divergence and falling below the recent trough. Expect a test
of support at 1140. Failure of 1140 would be a bearish sign: a
downward breakout from the
rising wedge pattern formed over the last 18 months.
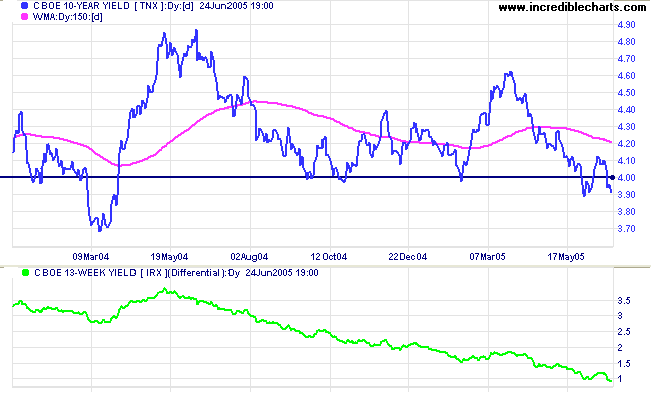
Treasury yields
The yield on 10-year treasury notes has again broken below 4.0%; a close below 3.9% would confirm further weakness. Falling long-term yields are a sign that funds are flowing out of equities and into bonds. If the yield is driven lower, there should be a corresponding fall in Twiggs Money Flow on the major indices.
Short-term yields continue to rise, resulting in a declining yield differential (10-year T-notes minus 13-week T-bills); now below 1.0%. A bearish (long-term) sign for equities.
Gold
New York: Spot gold pulled back briefly to successfully test support at $435, adding confirmation of the large triangle breakout, before rallying to close at $440.00 on Friday. The target for the breakout is $476 (432 + (454 - 410)), though resistance can be expected at $450.
New York: Spot gold pulled back briefly to successfully test support at $435, adding confirmation of the large triangle breakout, before rallying to close at $440.00 on Friday. The target for the breakout is $476 (432 + (454 - 410)), though resistance can be expected at $450.
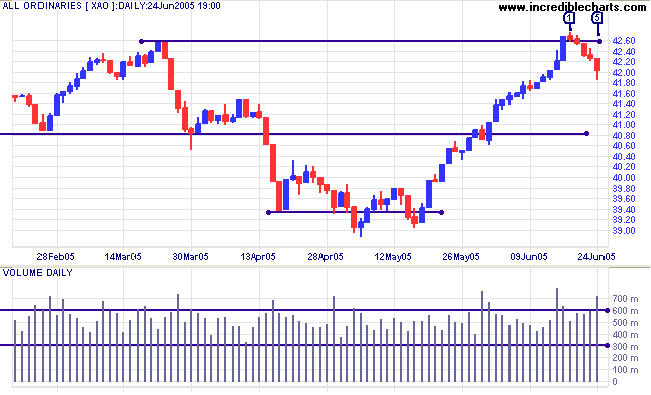
ASX Australia
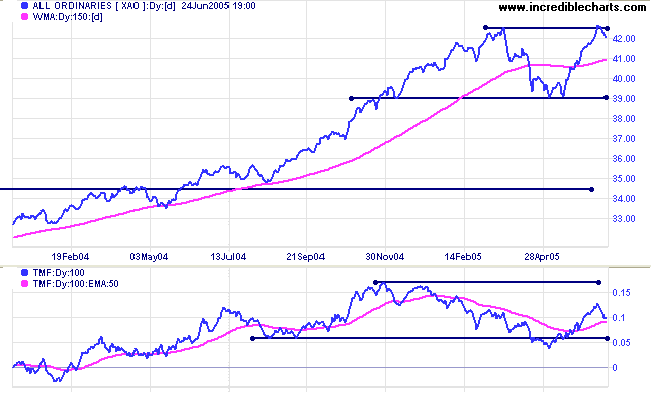
The All Ordinaries completed a bearish false break above the March 2005. Sellers took control on Monday [1], driving prices back below the new support level at 4260, with muted opposition from buyers. Strong support, however, emerged on Friday at [5], with a weak close and strong volume. Expect a rally to test resistance at the recent high. Failure to make a new high, in the week ahead, would be a strong bear signal. If a rally fails to materialize, with a close below Friday's low, expect a sharp drop to support at 3900.
I am obviously bearish about the All Ords' prospects, but a breakout above 4260, followed by a pull-back that respects the new support level, is still a possibility and would signal further gains, with a target of 4620 (4260 + (4260 - 3900)).
Twiggs Money Flow (100-day) fell sharply in the last few
days. The indicator is well below its November 2004 high and a
reversal short of this level would be a long-term bear
signal.
If the index falls below 3900, that would signal that a test of 3450 is likely, amounting to roughly a 50% retracement of the previous up-trend.
If the index falls below 3900, that would signal that a test of 3450 is likely, amounting to roughly a 50% retracement of the previous up-trend.
For further assistance, read About
the Trading Diary.
Colin Twiggs
It is true in finance as it is in philosophy or in any subject of
mortal thought,
that the general tendency of weak human nature is to believe what
one wants to believe
rather than what is so.
~ Daniel Kellog
as quoted by S.A Nelson in The ABC of Stock Speculation (1903).
rather than what is so.
~ Daniel Kellog
as quoted by S.A Nelson in The ABC of Stock Speculation (1903).
Back Issues
Access the Trading Diary Archives.