Trading Diary
June 18, 2005
These extracts from my daily trading diary are
for educational purposes and should not be interpreted as
investment advice. Full terms and conditions can be found at
Terms
of Use.
USA
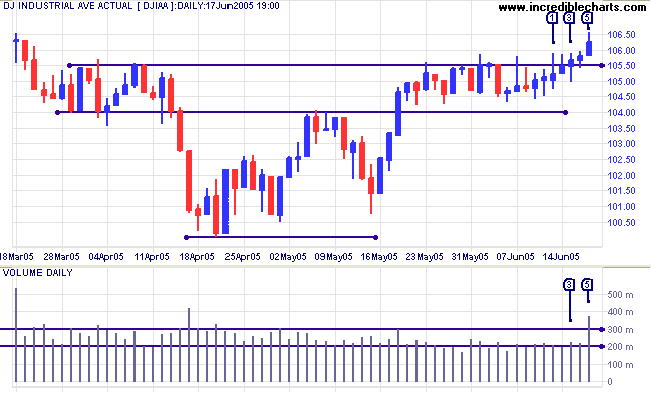
The Dow Industrial Average has broken out of the intermediate consolidation pattern, closing above resistance at [3], then drawing into a narrow range at [4], before further gains at [5]. Volumes were light until Friday [5] which experienced increased selling (signaled by the weak close). Expect a test of resistance at 10900/11000. A pull-back that respects 10550 would add confirmation; while a retreat below 10550 would signal further hesitancy.
The Dow Industrial Average has broken out of the intermediate consolidation pattern, closing above resistance at [3], then drawing into a narrow range at [4], before further gains at [5]. Volumes were light until Friday [5] which experienced increased selling (signaled by the weak close). Expect a test of resistance at 10900/11000. A pull-back that respects 10550 would add confirmation; while a retreat below 10550 would signal further hesitancy.
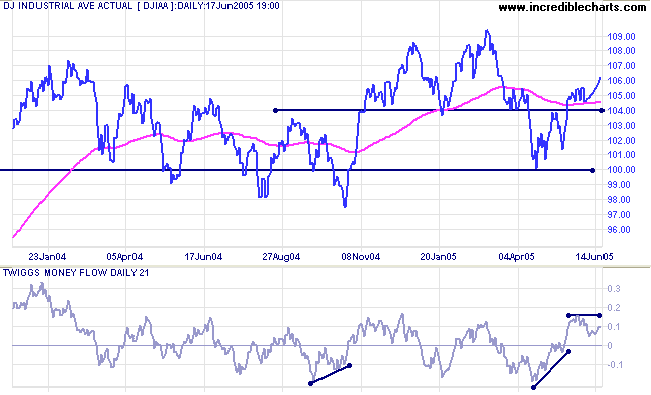
The last year has established strong support at 10000/9750. There
is also strong resistance at 11000/11500, shown by price action
from 1999 to 2001 and by recent highs in 2005. I expect to see a
lot more price action between these levels before there is a
clear breakout.
Twiggs Money Flow (21-day) signals accumulation, with a strong rise above the zero line. If the indicator rises above the recent high, without crossing below zero, that would be a further bull signal.
Twiggs Money Flow (21-day) signals accumulation, with a strong rise above the zero line. If the indicator rises above the recent high, without crossing below zero, that would be a further bull signal.
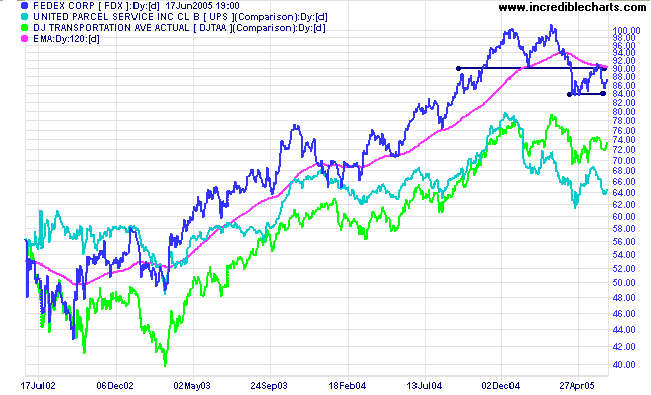
Transport indicators have failed to follow through on recent bear
signals. Watch for a rally that could take out the recent highs:
Fedex above 90.00 and UPS, similarly, above its May
high.
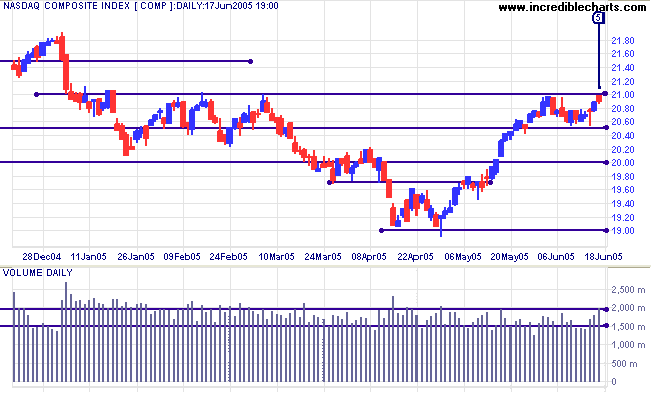
The Nasdaq Composite is testing resistance at 2100. A
close above this level (the high of the January to March
consolidation) would signal resumption of the primary up-trend.
Friday showed increased resistance with strong volume and a red
candle (weak close); so a fall below 2050 should not be
discounted, signaling a test of support at 1900.
The market appears to have more confidence in the (Dow) heavyweights.
The market appears to have more confidence in the (Dow) heavyweights.
The S&P 500 shows even greater confidence than the Dow
and is close to testing resistance at the March high of 1225. A
close above 1225 would signal resumption of the primary up-trend.
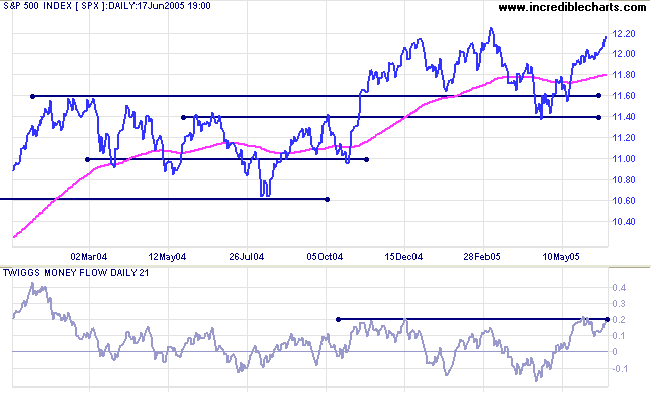
Twiggs Money Flow (21-day) displays a strong bull signal: a
pull-back that held above the zero line. A rise to a new 6-month
high would confirm.
Treasury yields
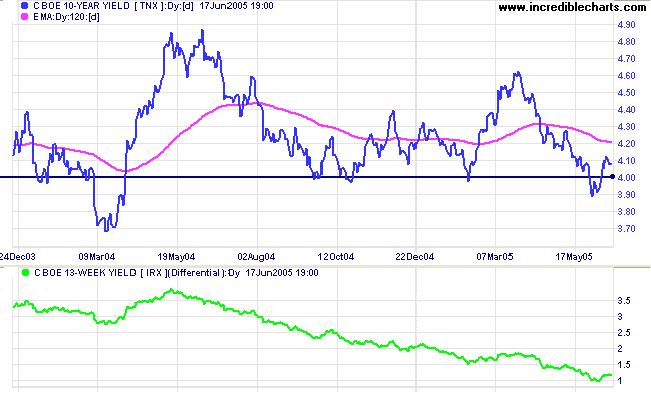
The yield on 10-year treasury notes appears headed for another test of support at 4.0%. If the new support level holds, expect a test of resistance at 4.60%. The yield differential (10-year T-notes minus 13-week T-bills) is just over 1.0%; a further decline would be a long-term bear signal for equities.
The yield on 10-year treasury notes appears headed for another test of support at 4.0%. If the new support level holds, expect a test of resistance at 4.60%. The yield differential (10-year T-notes minus 13-week T-bills) is just over 1.0%; a further decline would be a long-term bear signal for equities.
Gold
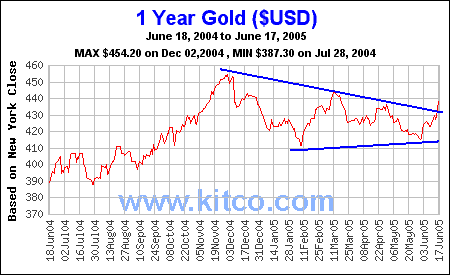
New York: Spot gold has broken out above a large (6-month) triangle, rallying to close at $437.70 on Friday. A pull-back that respects the April high of $435.70 would be an added bull signal. The target for the breakout is $476 (432 + (454 - 410)), though resistance can be expected at $450.
New York: Spot gold has broken out above a large (6-month) triangle, rallying to close at $437.70 on Friday. A pull-back that respects the April high of $435.70 would be an added bull signal. The target for the breakout is $476 (432 + (454 - 410)), though resistance can be expected at $450.
ASX Australia
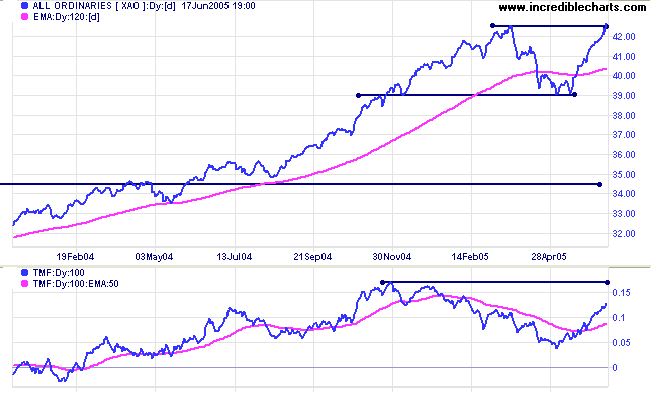
The All Ordinaries broke through resistance at the March 2005 high of 4260. Buyers overcame strong resistance at [3] (signaled by the weak close and strong volume) and went on to drive prices through the previous high with light opposition (note the strong close and volume). This leaves us with two likely scenarios:
The All Ordinaries broke through resistance at the March 2005 high of 4260. Buyers overcame strong resistance at [3] (signaled by the weak close and strong volume) and went on to drive prices through the previous high with light opposition (note the strong close and volume). This leaves us with two likely scenarios:
- If the index breaks above 4255 and then retreats (below 4225) within a day or two (a false break), that would be a strong bear signal.
- If the breakout is followed by a pull-back that respects the new support level, we can expect a bull rally with a target of 4620 (4260 + (4260 - 3900)). Judging from the strength of buying in the last two days, we cannot discount this.
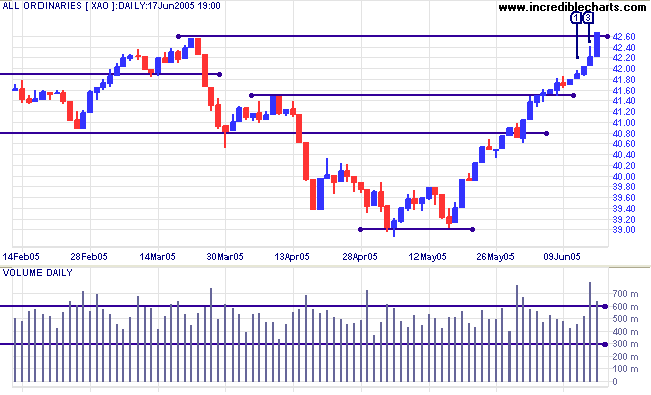
We can see on the
Twiggs Money Flow (100-day) that accumulation has resumed in
earnest. However, the indicator is well below its November 2004
high and a reversal short of this level would be a bearish sign.
A test of 3450, amounting to roughly a 50% retracement of the
previous up-trend, is not yet out of the picture.
For further assistance, read About
the Trading Diary.
Colin Twiggs
Presence of mind . . .
is nothing but an increased capacity of dealing with the unexpected.
~ Claus von Clausewitz: Vom Kriege (1831)
is nothing but an increased capacity of dealing with the unexpected.
~ Claus von Clausewitz: Vom Kriege (1831)
Back Issues
Access the Trading Diary Archives.