Trading Diary
May 7, 2005
These extracts from my daily trading diary are
for educational purposes and should not be interpreted as
investment advice. Full terms and conditions can be found at
Terms
of Use.
USA
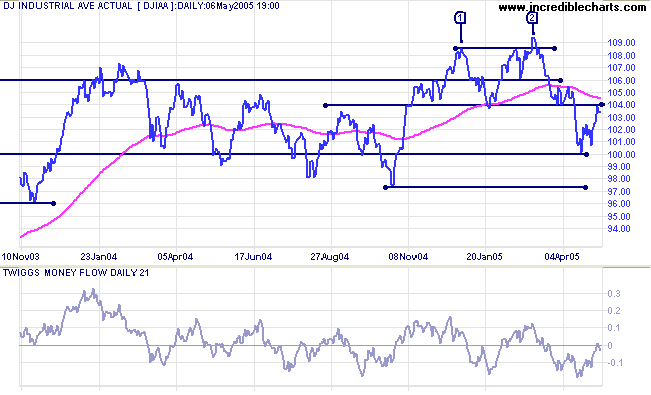
The Dow Industrial Average is testing resistance at 10400. The index faltered at [4], after the down-grading of General Motors and Ford to junk bond status. An inside day on Friday indicates continued uncertainty.
The Dow Industrial Average is testing resistance at 10400. The index faltered at [4], after the down-grading of General Motors and Ford to junk bond status. An inside day on Friday indicates continued uncertainty.
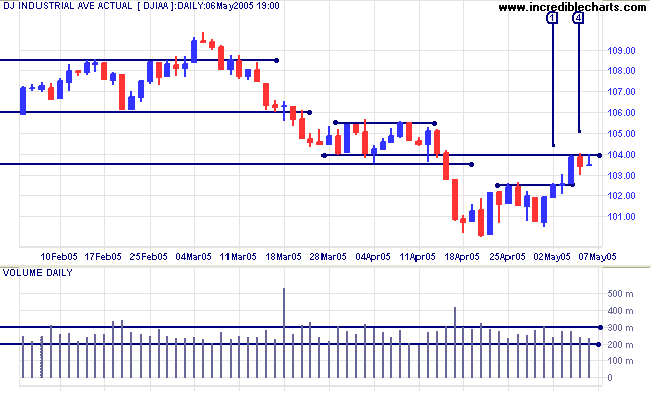
Twiggs Money Flow (21-day) remains below zero, signaling
distribution.
If resistance at 10400 holds, we can expect another test of support at 10000. A Dow close below 10000 would trigger a fresh spate of selling; and a fall below 9750 would signal that a test of 7500 (from March 2003) is likely.
If resistance at 10400 fails, we are likely to see a continuation of the top pattern.
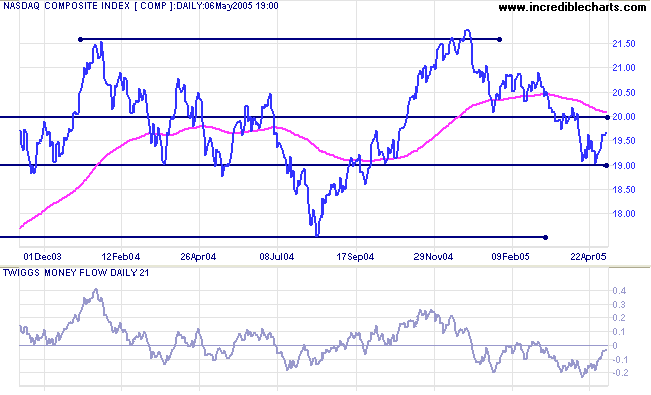
The Nasdaq Composite is testing resistance at 1970 after a
small bullish divergence on
Twiggs Money Flow (21-day). TMF remains below zero. Expect
the index to hold below 2000, followed by a primary down-trend to
test support at 1750.
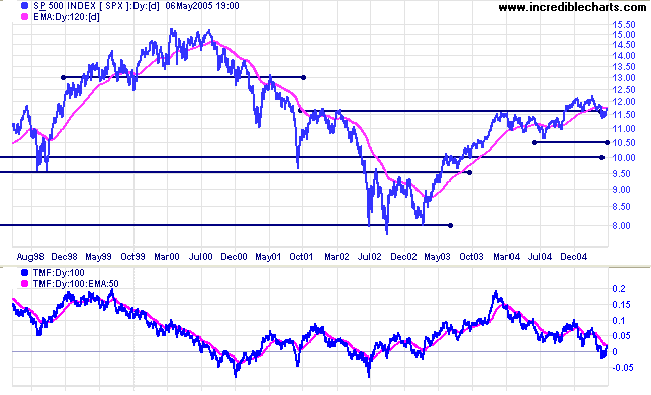
The S&P 500 broke through resistance at 1165 on strong
volume at [3]. The rally then faltered, with weak closes and
declining volume at [4] and [5]. It appears that the
down-trend has slowed and further consolidation is
likely.
Tops are often volatile and take time to resolve into a clear direction.
Tops are often volatile and take time to resolve into a clear direction.
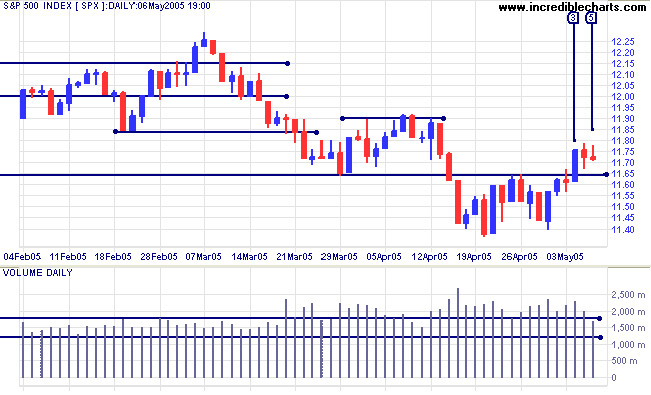
Twiggs Money Flow (100-day) below the signal line shows
continued distribution.
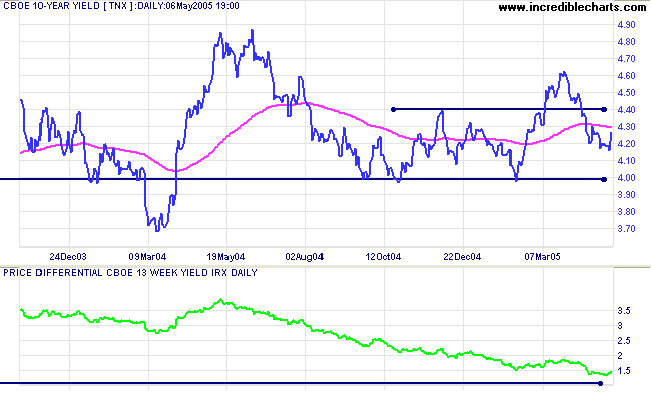
Treasury yields
The yield on 10-year treasury notes appears headed for another test of support at 4.0%.
The yield differential (10-year T-notes minus 13-week T-bills) is declining (currently at 1.5%). Below 1.0% would be a long-term bear signal for equities.
The yield on 10-year treasury notes appears headed for another test of support at 4.0%.
The yield differential (10-year T-notes minus 13-week T-bills) is declining (currently at 1.5%). Below 1.0% would be a long-term bear signal for equities.
Gold
New York: Spot gold fell sharply on Friday to close the week at $425.70. This is a bearish sign, being a lower (intermediate) high than 11 March. Expect support at $420. If that fails, the primary trend is downward. Further support levels are close by, however, at $410 (the February low) and $400 (the round number).
New York: Spot gold fell sharply on Friday to close the week at $425.70. This is a bearish sign, being a lower (intermediate) high than 11 March. Expect support at $420. If that fails, the primary trend is downward. Further support levels are close by, however, at $410 (the February low) and $400 (the round number).
ASX Australia
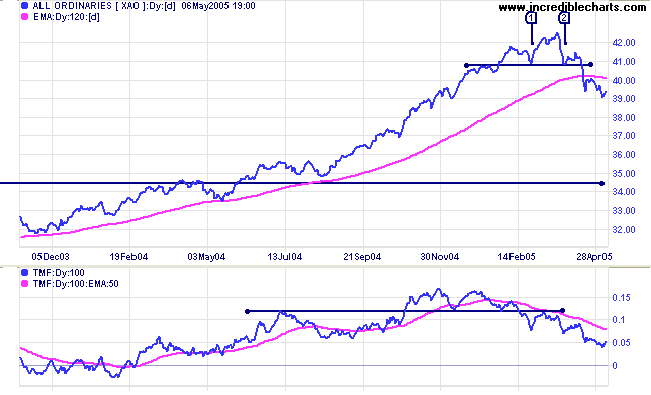
The All Ordinaries broke through support at 3940 on strong volume at [3]. Strong volume and a long tail the next day signal that there are still plenty of buyers around. Friday [5] tested the new resistance level at 3940; a close above this level would signal that the down-trend is slowing.
The All Ordinaries broke through support at 3940 on strong volume at [3]. Strong volume and a long tail the next day signal that there are still plenty of buyers around. Friday [5] tested the new resistance level at 3940; a close above this level would signal that the down-trend is slowing.
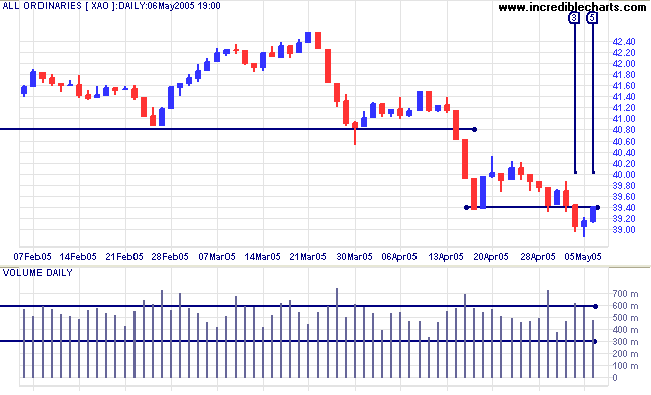
Twiggs Money Flow (100-day) continues to signal distribution,
with declining peaks below the signal line.
At some point we can expect a bear market rally, with remaining buying energy spent on a test of resistance at 4080 (from the lows of [1] and [2]). That is likely to be followed by a sharp down-trend that tests support at 3450.
At some point we can expect a bear market rally, with remaining buying energy spent on a test of resistance at 4080 (from the lows of [1] and [2]). That is likely to be followed by a sharp down-trend that tests support at 3450.
A test of support at the 2002 high of 3450 would amount to
roughly a 50% retracement of the primary up-trend. If you review
the
All Ords over the past 25 years, the index has regularly cut
back to test support at previous highs during an up-trend.
For further assistance, read About
the Trading Diary.
Colin Twiggs
If you don't risk anything you risk even more.
~ Erica Jong
~ Erica Jong
Back Issues
Access the Trading Diary Archives.