Trading Diary
April 30, 2005
These extracts from my daily trading diary are
for educational purposes and should not be interpreted as
investment advice. Full terms and conditions can be found at
Terms
of Use.
USA
The Dow Industrial Average is consolidating above support at 10000. Strong volume on Friday's blue candle [5] indicates that another test of resistance is likely.
A close above 10350, though unlikely, would signal that the primary down-trend has weakened.
The Dow Industrial Average is consolidating above support at 10000. Strong volume on Friday's blue candle [5] indicates that another test of resistance is likely.
A close above 10350, though unlikely, would signal that the primary down-trend has weakened.
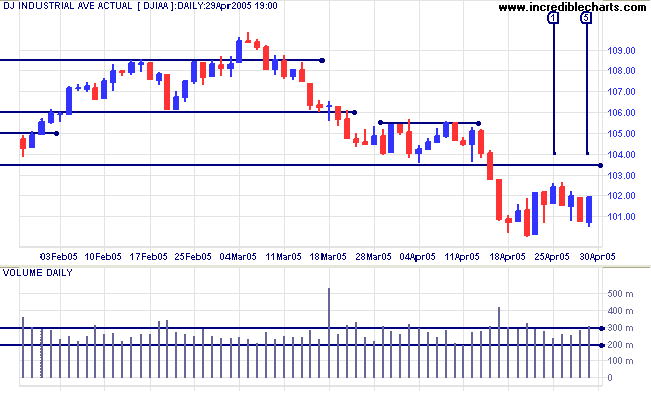
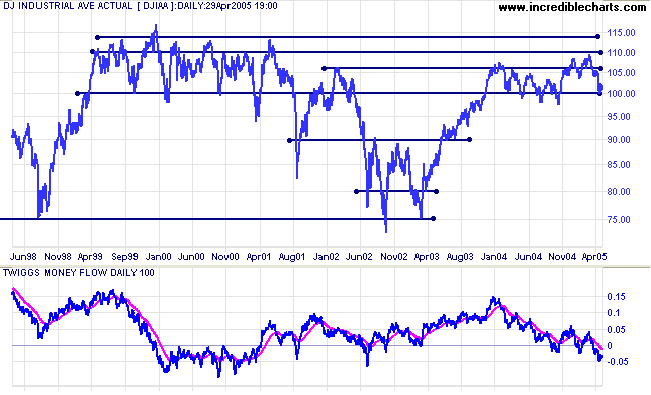
Twiggs Money Flow (100-day) continues to fall, signaling
distribution.
A Dow close below 10000 would trigger a fresh spate of selling; and a fall below 9750 would signal that a test of 7500 (from March 2003) is likely.
A Dow close below 10000 would trigger a fresh spate of selling; and a fall below 9750 would signal that a test of 7500 (from March 2003) is likely.
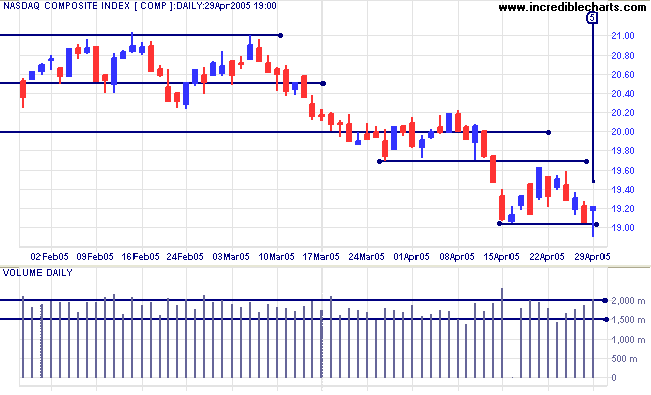
The Nasdaq Composite index has encountered support at
1900, with a long tail and strong volume on Friday [5] signaling
that buyers were dominant.
Twiggs Money Flow (21-day) shows a small bullish
divergence. Expect a rally to test resistance at 1960.
In the longer term, expect the primary down-trend to test support at 1750.
In the longer term, expect the primary down-trend to test support at 1750.
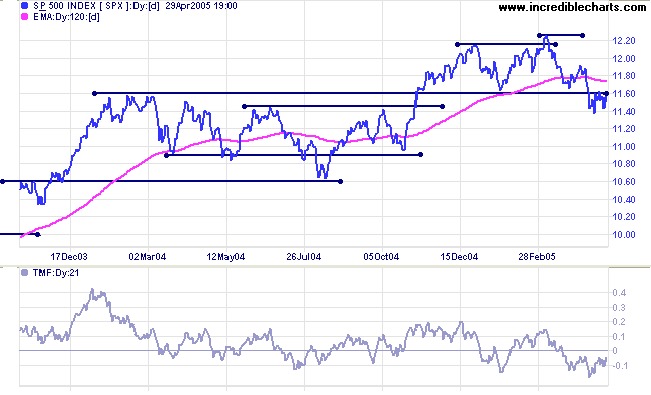
The S&P 500 is consolidating between 1135 and 1165.
The blue candle on Friday [5], accompanied by strong volume,
indicates that another test of resistance at 1165 is
likely. A close above 1165 would signal that the primary
down-trend is weak.
Tops are often volatile and take time to resolve into a clear direction.
Tops are often volatile and take time to resolve into a clear direction.
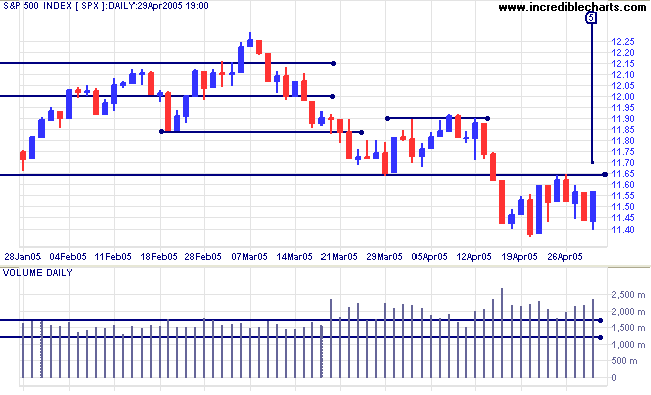
Twiggs Money Flow (21-day) continues to signal
distribution.
A fall below 1135 would tell us to expect a test of support at 1060. If that fails, the next level is the round number of 1000.
A fall below 1135 would tell us to expect a test of support at 1060. If that fails, the next level is the round number of 1000.
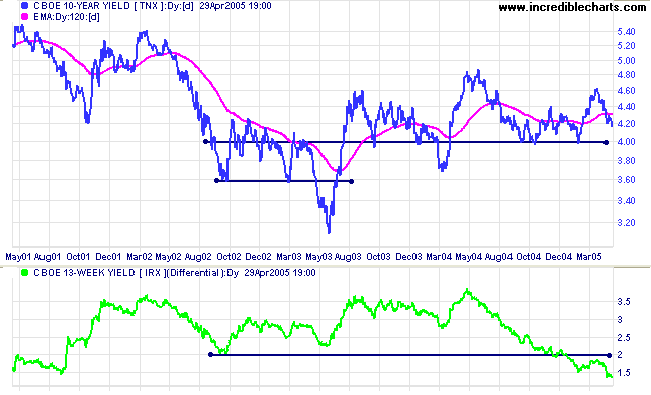
Treasury yields
The yield on 10-year treasury notes appears headed for another test of support at 4.0%.
The yield differential (10-year T-notes minus 13-week T-bills) is at 1.4%. Below 1.0% would be a long-term bear signal for equities.
The yield on 10-year treasury notes appears headed for another test of support at 4.0%.
The yield differential (10-year T-notes minus 13-week T-bills) is at 1.4%. Below 1.0% would be a long-term bear signal for equities.
Gold
New York: Spot gold is holding above resistance at $430, closing the week at $434.40. A breakout breakout above $437 would likely test resistance at $445 (the March high). If resistance at $445 holds, forming a double top below primary resistance (at $450), that would be a long-term bear signal.
New York: Spot gold is holding above resistance at $430, closing the week at $434.40. A breakout breakout above $437 would likely test resistance at $445 (the March high). If resistance at $445 holds, forming a double top below primary resistance (at $450), that would be a long-term bear signal.
ASX Australia
Sellers dominated the All Ordinaries this week, with red candles from Tuesday [1] to Friday [4]. However, weak closes at [1], [2] and [4] indicate the presence of buyers in sufficient numbers to prevent a "free-fall". Big volume on Friday failed to push the close below support and we may see another attempted rally/further consolidation in the next few days. A close below 3940 would signal weakness.
Though unlikely, a rally above 4080 would mean that all bets are off and the top formation is likely to continue.
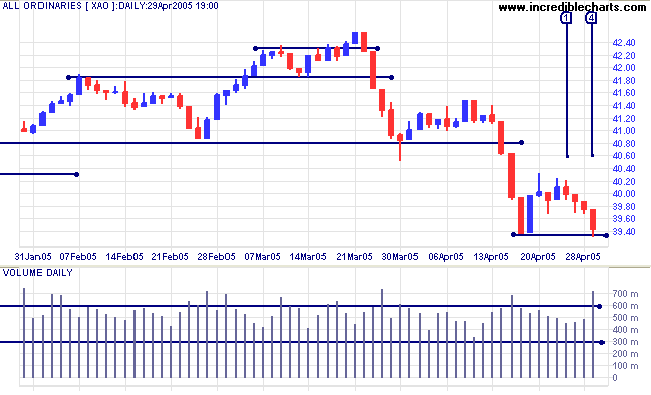
Twiggs Money Flow (100-day) continues to signal distribution,
with declining peaks below the signal line.
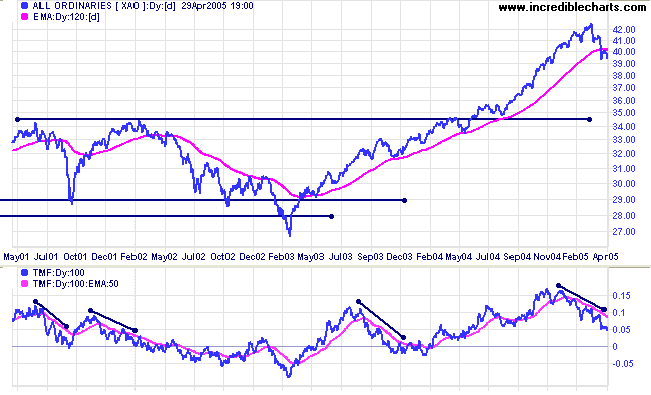
The secondary correction is likely to test support at the 2002
high of 3450. This would amount to roughly a 50% retracement of
the primary up-trend. This is not a prediction but a warning to
those traders who may be tempted to ride out the correction.
Based on observation of the
All Ords over the past 25 years, the index has regularly cut
back to test support at previous highs during an up-trend.
For further assistance, read About
the Trading Diary.
Colin Twiggs
It seems to me that people have vast potential.
Most people can do extraordinary things if they have the confidence or take the risks.
Yet most people don't. They sit in front of the telly and treat life as if it goes on forever.
~ Philip Adams
Most people can do extraordinary things if they have the confidence or take the risks.
Yet most people don't. They sit in front of the telly and treat life as if it goes on forever.
~ Philip Adams
Back Issues
Access the Trading Diary Archives.