Trading Diary
February 5, 2005
These extracts from my daily trading diary are for educational
purposes and should not be interpreted as investment advice. Full
terms and conditions can be found at Terms
of Use.
USA
The Dow Industrial Average has respected support at 10350, reversing into an up-swing after a breakout above 10500. The index consolidated Thursday below resistance at 10600 before a further breakout above 10600 completed the (intermediate) reversal. This is a strong bull signal. Look for a pull-back that respects support at 10600 to add confirmation.
The Dow Industrial Average has respected support at 10350, reversing into an up-swing after a breakout above 10500. The index consolidated Thursday below resistance at 10600 before a further breakout above 10600 completed the (intermediate) reversal. This is a strong bull signal. Look for a pull-back that respects support at 10600 to add confirmation.
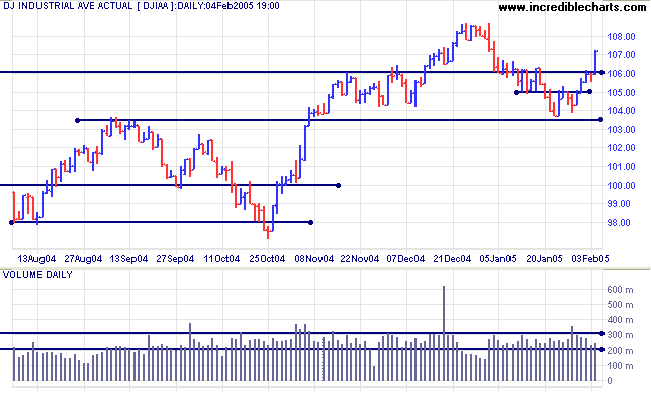
If price holds above 10600 in the next few weeks, expect a test
of resistance at 11400.
Twiggs Money Flow (100-day) has crossed above its signal line.
Twiggs Money Flow (100-day) has crossed above its signal line.
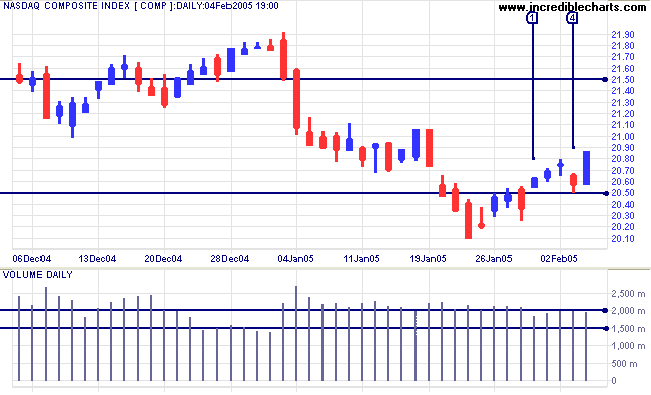
The Nasdaq Composite closed back above 2050, completing a
bear trap - a strong bull signal. This was confirmed by the
short pull-back on Thursday [4] which respected the new support
level.
Twiggs Money Flow (21-day) is rising but still below the signal line.
Twiggs Money Flow (21-day) is rising but still below the signal line.
The S&P 500 has respected the initial level of support
at 1160: a strong bull signal. The next level of resistance is at
1300, with major resistance around 1500.
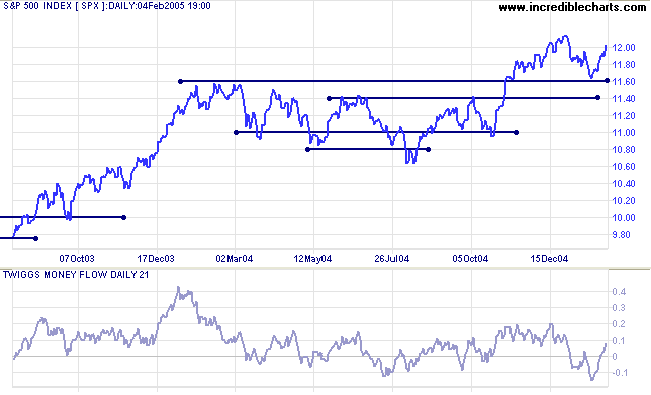
Twiggs Money Flow has crossed to above the zero line,
signaling accumulation.
|
|
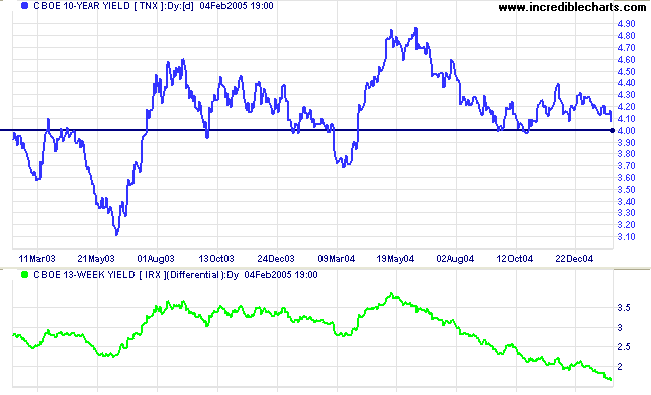
Treasury yields
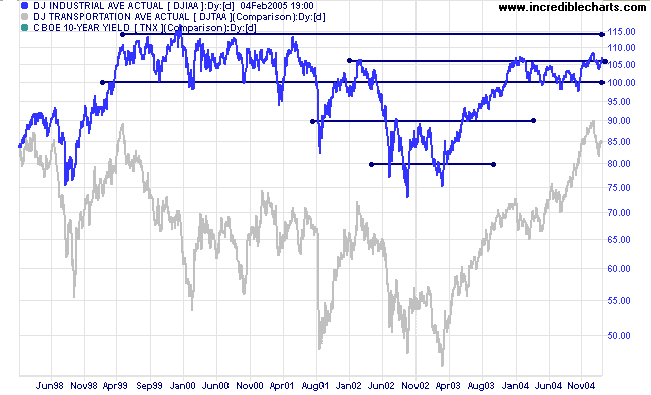
The Fed sprung no surprises at its recent meeting, raising interest rates by another quarter per-cent, consistent with the last 5 meetings. Market fears of a steep rates rise appear to have eased and the yield on 10-year treasury notes remains soft, heading down for another test of support at 4.00%.
Expect support at 4.00% to hold. A fall below support, though unlikely, would be bearish for equities.
The yield differential (10-year T-notes minus 13-week T-bills) continues to fall, reaching 1.65% this week. Below 1.0% would be a long-term bear signal for equity markets.
Gold
New York: Spot gold has broken through support at $420 at the base of the recent consolidation, closing down at $414.00. Expect a test of support at $400 and possibly the 1-year low of $375.
Reversal back above $420 would be a bull signal (bear trap - price reverses back above support).
New York: Spot gold has broken through support at $420 at the base of the recent consolidation, closing down at $414.00. Expect a test of support at $400 and possibly the 1-year low of $375.
Reversal back above $420 would be a bull signal (bear trap - price reverses back above support).
|
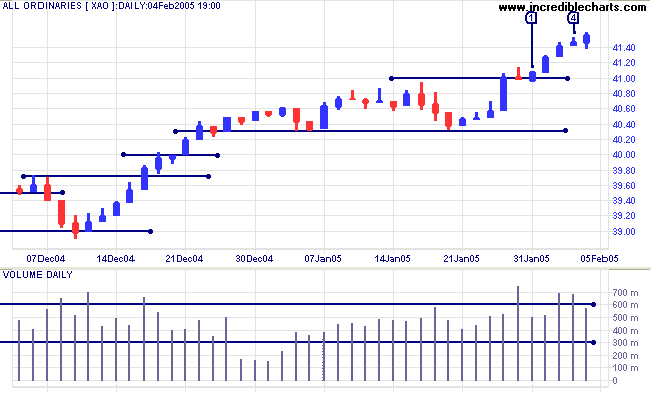
ASX Australia
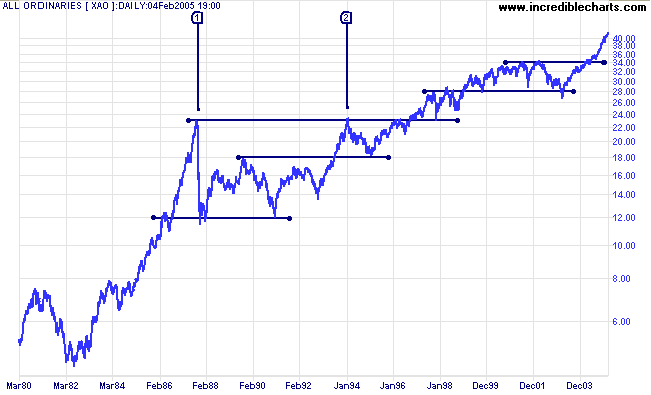
The bull rally on the All Ordinaries continues. Selling pressure dissipated on Monday [1] with a close back above 4100 on normal volume. This occurred again on Wednesday to Friday, with increased volume signaling distribution but the index still closed higher on each of the three days. Short pull-backs as at [1] and [4] signal a strong bull market and we can expect further gains.
The bull rally on the All Ordinaries continues. Selling pressure dissipated on Monday [1] with a close back above 4100 on normal volume. This occurred again on Wednesday to Friday, with increased volume signaling distribution but the index still closed higher on each of the three days. Short pull-backs as at [1] and [4] signal a strong bull market and we can expect further gains.
Keep an eye on 21-day
Twiggs Money Flow. It has recovered from its low but a
further down-swing would be bearish.
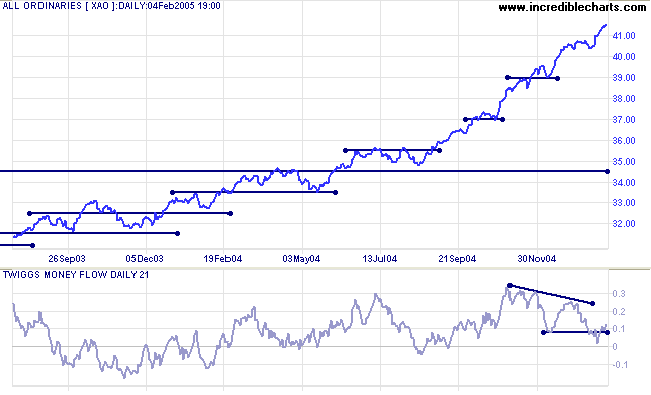
The primary trend still appears strong but we need to bear in
mind that at some point there is likely to be a correction back
to 3450. This is based on observation of the
All Ords over the past 25 years, where the index has
regularly tested support at previous highs in an up-trend. The
rally so far resembles [2]. The only rally which did not test
support at previous highs was the extended bull run prior to
October 1987 [1]. The current market is still a long way from
that.
For further assistance, read About
the Trading Diary.
Colin Twiggs
The usual bull market successfully weathers a number of
tests
until it is considered invulnerable,
whereupon it is ripe for a bust.
~ George Soros
until it is considered invulnerable,
whereupon it is ripe for a bust.
~ George Soros
Back Issues
Access the Trading Diary Archives.