Trading Diary
December 18, 2004
These extracts from my daily trading diary are for educational
purposes and should not be interpreted as investment advice. Full
terms and conditions can be found at Terms
of Use.
USA
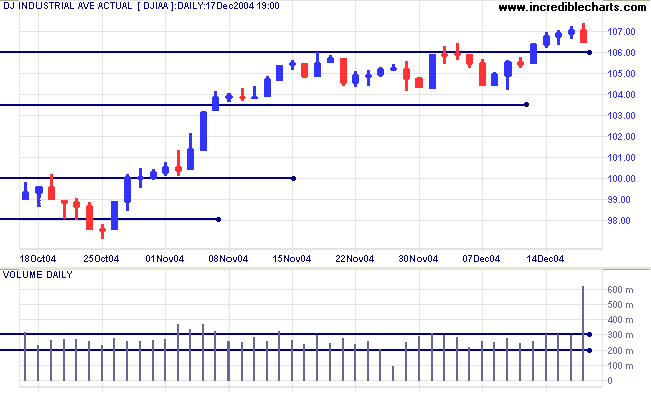
The Dow Industrial Average posted massive volume after an 11% sell-off in Pfizer. The drug company announced that it would not be withdrawing arthritis drug Celebrex from the market, despite a study suggesting that prolonged use more than doubles the risk of heart attack. Following Merck's recall of a similar painkilling drug, Vioxx, 11 weeks ago, and Pfizer's repeated assurances regarding Celebrex, the findings could not have come at a worse time.
Overall, volumes were generally high and the index closed down after five consecutive day's gains. Expect a test of the new 10600 support level. A successful test would confirm the breakout signal, while a fall below 10600 would signal further consolidation.
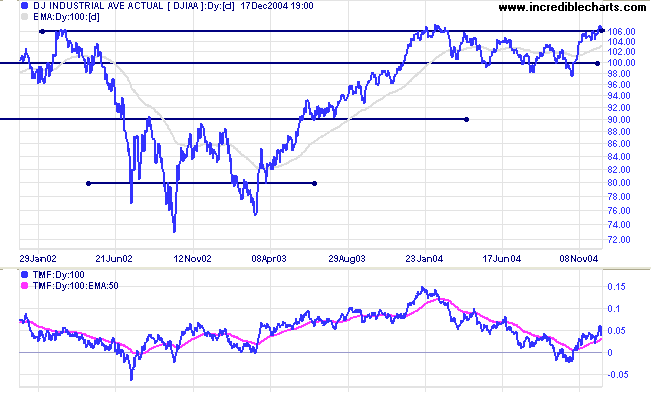
Twiggs Money Flow is above its 50-day MA, signaling
accumulation.
The primary trend is up and the breakout above 10600 indicates that 11400 is achievable. First expect a (short- to medium-term) pull-back to test support at the breakout.
A fall below 10000 would be a (long-term) bear signal.
The primary trend is up and the breakout above 10600 indicates that 11400 is achievable. First expect a (short- to medium-term) pull-back to test support at the breakout.
A fall below 10000 would be a (long-term) bear signal.
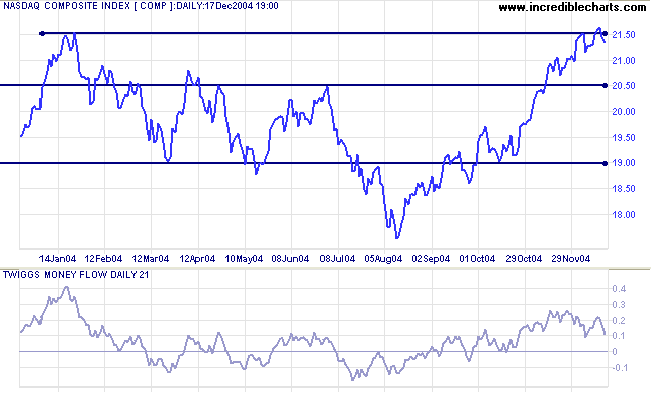
The Nasdaq Composite made a marginal (false) break above
2150 before retreating on heavy volume. Expect a correction to
test support at 2050. Narrow consolidation below 2150 would be
bullish, signaling a breakout in the longer term.
Twiggs Money Flow (21-day) is above zero but has formed a lower high, suggesting short-term distribution.
Twiggs Money Flow (21-day) is above zero but has formed a lower high, suggesting short-term distribution.
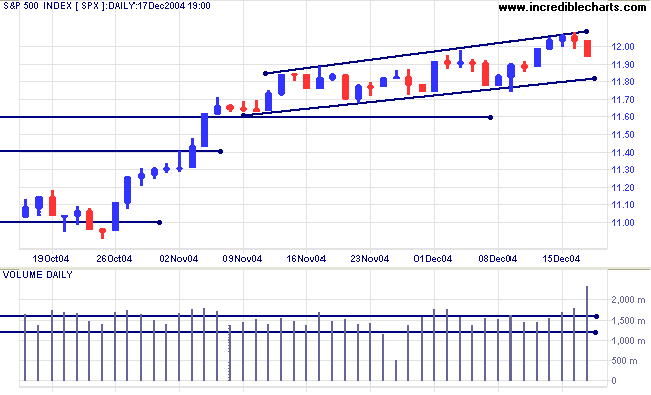
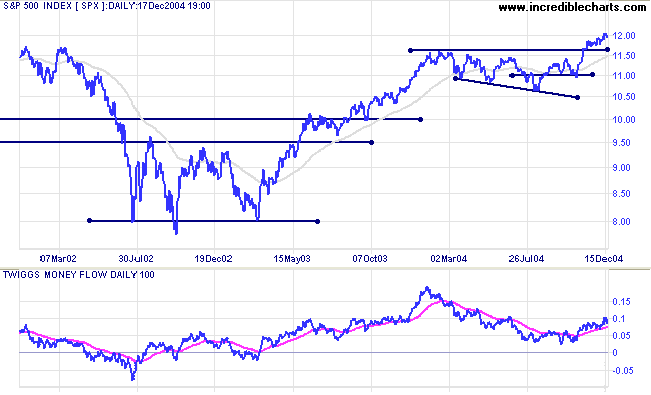
The S&P 500 has been edging upwards in a narrow flag
pattern for more than a month. We again have increased volume at
the reversal on the upper border of the pattern, increasing the
likelihood of a test of support at 1160.
A breakout above the upper border of the flag pattern (not just a false break), would be a bullish continuation signal.
A breakout above the upper border of the flag pattern (not just a false break), would be a bullish continuation signal.
Twiggs Money Flow continues to signal strong
accumulation.
The primary trend is up. A correction that respects support at 1160 would be a long-term bull signal.
With no major resistance levels overhead we can expect good (long-term) gains.
The primary trend is up. A correction that respects support at 1160 would be a long-term bull signal.
With no major resistance levels overhead we can expect good (long-term) gains.
|
|
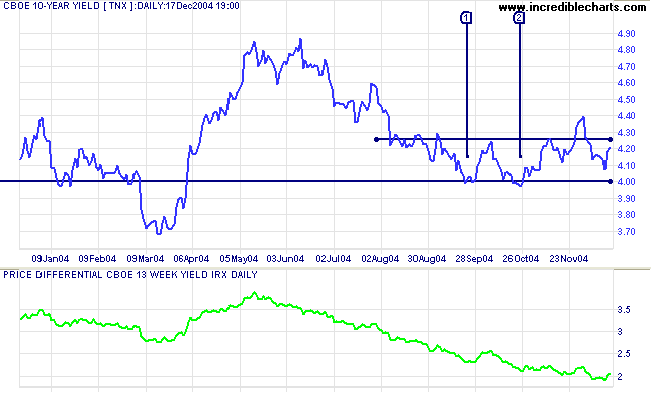
Treasury yields
The yield on 10-year treasury notes rallied slightly, after the latest Fed rate hike, but is still below resistance at 4.25%. Soft long-term yields indicate that the bond market is holding its own (with no major outflows) against equities.
Steady increases in short-term yields have been flattening the yield curve, with the yield differential (10-year T-notes minus 13-week T-bills) declining to 2.0%. A fall below 1.0% would be a long-term bear signal.
Gold
New York: Spot gold is edging slowly upwards, closing at $441.40. The flag pattern over the last week suggests that the metal is more likely to test resistance at $450 than to test support at $430.
New York: Spot gold is edging slowly upwards, closing at $441.40. The flag pattern over the last week suggests that the metal is more likely to test resistance at $450 than to test support at $430.
|
ASX Australia
The All Ordinaries (and ASX 200) displayed a tall blue candle with increased volume on Thursday, indicating strong buying with minimal opposition from sellers. Friday shows a weaker close, below resistance at 4000, with lower volume. There are no significant signs of selling at this level. Expect further gains, though remain vigilant for signs of increased resistance: increased volumes with marginal or no gains.
The All Ordinaries (and ASX 200) displayed a tall blue candle with increased volume on Thursday, indicating strong buying with minimal opposition from sellers. Friday shows a weaker close, below resistance at 4000, with lower volume. There are no significant signs of selling at this level. Expect further gains, though remain vigilant for signs of increased resistance: increased volumes with marginal or no gains.
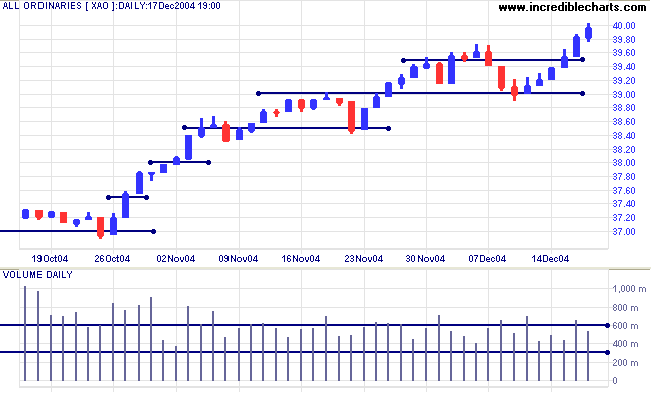
Twiggs Money Flow continues to signal accumulation.
The primary up-trend is strong. The latest rally is steep and at some stage (perhaps at 4000) increased profit-taking will force a correction.
The primary up-trend is strong. The latest rally is steep and at some stage (perhaps at 4000) increased profit-taking will force a correction.
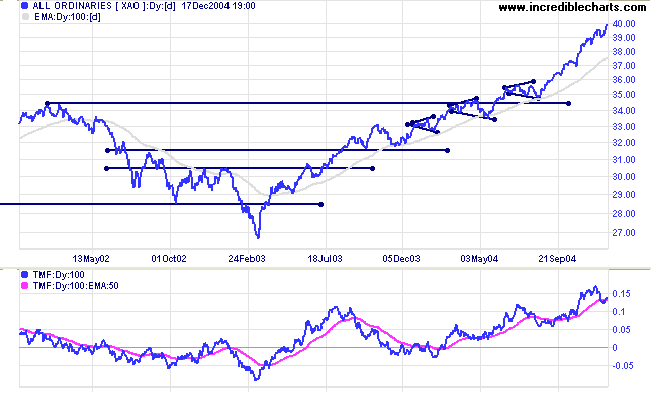
At some point we can expect a major correction to test support at
the 2002 high of 3450 (xjo: 3500).
For further assistance, read About
the Trading Diary.
Colin Twiggs
Once we realize that imperfect understanding is the human
condition
there is no shame in being wrong, only in failing to correct our mistakes.
~ George Soros
there is no shame in being wrong, only in failing to correct our mistakes.
~ George Soros
Back Issues
Access the Trading Diary Archives.