Trading Diary
November 6, 2004
These extracts from my daily trading diary are for educational
purposes and should not be interpreted as investment advice. Full
terms and conditions can be found at Terms
of Use.
USA
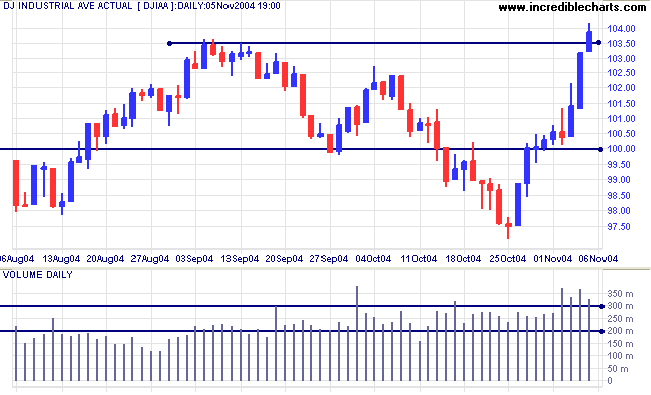
The Dow Industrial Average posted a rally on the back of the election results, breaking through resistance at 10350 on strong volume. Consolidation (or a pull-back) that respects the new support level would confirm the breakout from the consolidation pattern and continuation of the primary up-trend.
The Dow Industrial Average posted a rally on the back of the election results, breaking through resistance at 10350 on strong volume. Consolidation (or a pull-back) that respects the new support level would confirm the breakout from the consolidation pattern and continuation of the primary up-trend.
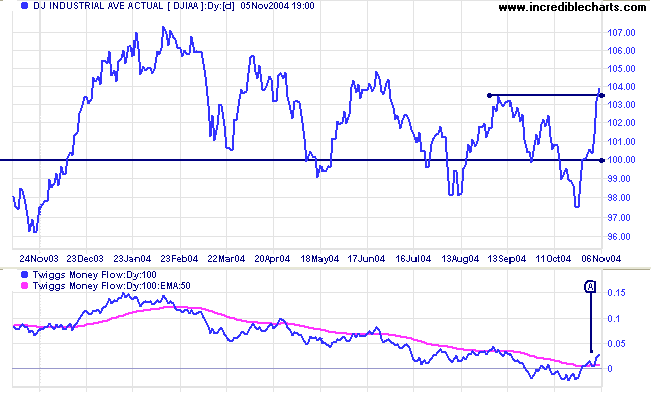
The longer-term chart clearly displays the consolidation pattern
and the breakout. Even if the index fails to hold above 10350, a
successful test of support at 10000 would be a bullish
sign. A fall below 10000 would be bearish.
Twiggs Money Flow completed a short pull-back [A] above its signal line, signaling strong accumulation.
Twiggs Money Flow completed a short pull-back [A] above its signal line, signaling strong accumulation.
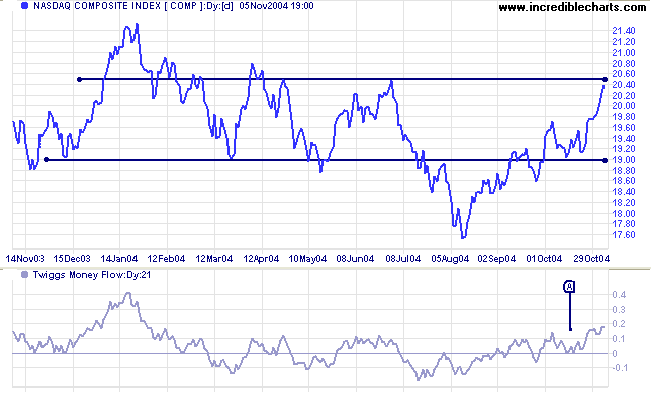
The Nasdaq Composite index rallied to test resistance at
2050. A break through this level would signal a reversal of the
primary trend.
Twiggs Money Flow (21-day) gives a clear accumulation signal, with a trough above the zero line at [A].
Twiggs Money Flow (21-day) gives a clear accumulation signal, with a trough above the zero line at [A].
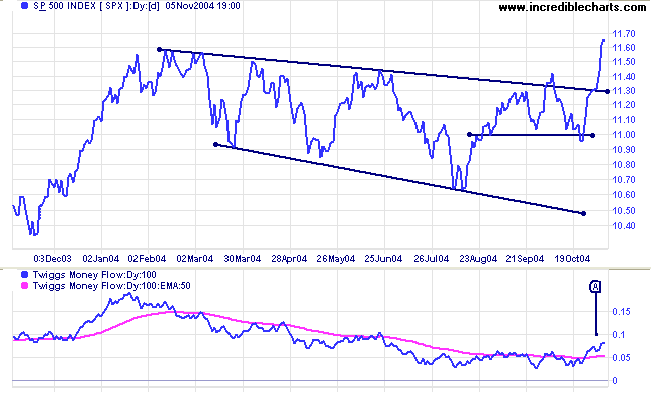
The S&P 500 completed an upward breakout of the
broadening (descending) wedge. Expect a pull-back to test the new
support level at 1130/1140. The projected target for the breakout
is 1240: the breakout point (1140) plus the pattern high (1160)
minus the low (1060).
Twiggs Money Flow has completed a bullish trough above the signal line at [A], signaling accumulation.
Twiggs Money Flow has completed a bullish trough above the signal line at [A], signaling accumulation.
|
|
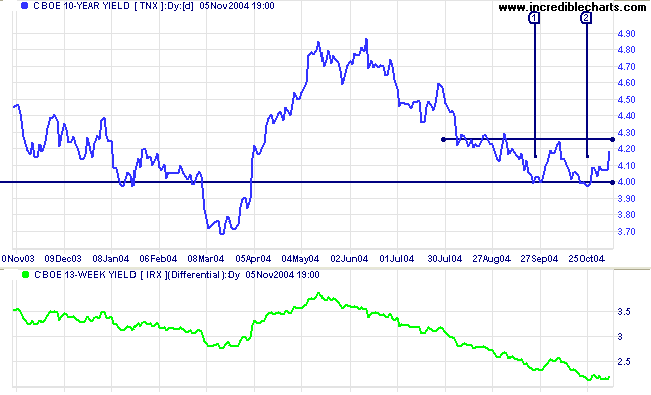
Treasury yields
The yield on 10-year treasury notes has completed a false break below support at 4.00% before rallying strongly. The false break is normally a bullish sign and may signal a rally to test resistance at 4.5%. Look for a double bottom breakout above 4.25% to confirm.
The yield differential (10-year T-notes minus 13-week T-bills) has fallen to 2.2%. Differentials below 1.0% (as at [C]) are (long-term) bear signals, while a fall below zero (as at [D]) is even stronger.
Gold
New York: Spot gold has broken through resistance at $430 to reach a 16-year high, closing at $432.90 on Friday.
The brief (and narrow) consolidation below resistance was a bullish sign. Expect a short pull-back after the breakout to re-test the new support level. If successful, we can look forward to further gains: the next major resistance level is 500.
|
ASX Australia
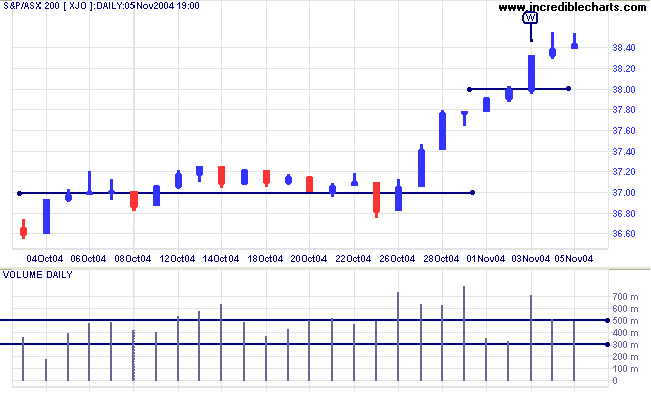
The ASX 200 broke through resistance at 3800 on strong volume. Thursday and Friday reflect consolidation below resistance at 3850, with weak closes on high volume. Failure to retrace any of the preceding follow-through day [W] is a short-term bull signal. A rise above 3850 would signal that a test of 3900 is likely. Look for confirmation from strong volume and/or a close above the resistance level.
The ASX 200 broke through resistance at 3800 on strong volume. Thursday and Friday reflect consolidation below resistance at 3850, with weak closes on high volume. Failure to retrace any of the preceding follow-through day [W] is a short-term bull signal. A rise above 3850 would signal that a test of 3900 is likely. Look for confirmation from strong volume and/or a close above the resistance level.
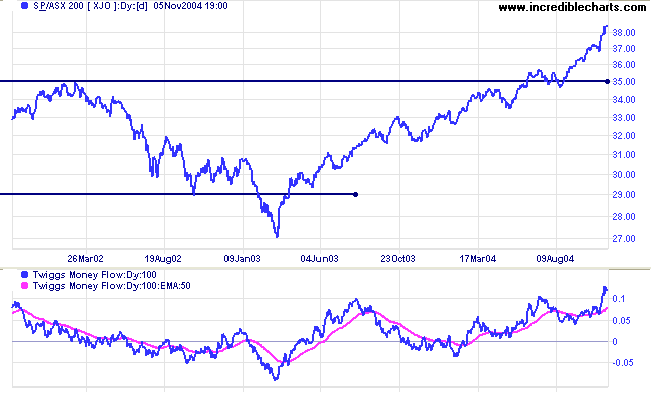
Twiggs Money Flow is rising steeply, signaling strong
accumulation.
The primary up-trend is strong. The latest rally is unusually steep and at some stage (perhaps at 4000) increased profit-taking will force a correction. Allow for a re-test of support at 3500 (the highs from 2002).
The primary up-trend is strong. The latest rally is unusually steep and at some stage (perhaps at 4000) increased profit-taking will force a correction. Allow for a re-test of support at 3500 (the highs from 2002).
For further assistance, read About
the Trading Diary.
Colin Twiggs
Disaster is that on which good fortune
depends.
Good fortune is that in which disaster is concealed.
~ Lao Tse
Good fortune is that in which disaster is concealed.
~ Lao Tse
Back Issues
Access the Trading Diary Archives.