USA
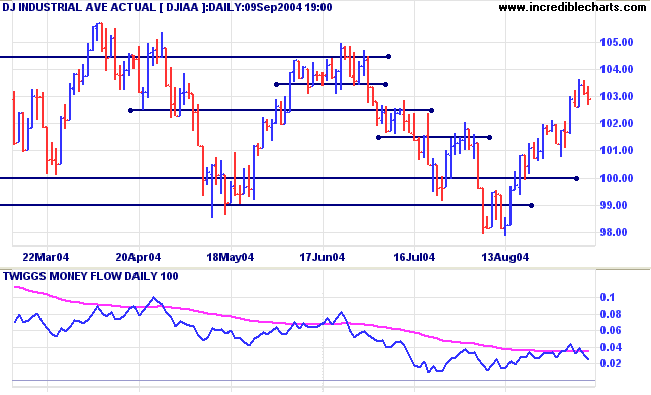
The Dow Industrial Average shows bearish increased volume on the last two days down-swing. Low volume during the rally over recent weeks indicates a lack of commitment from buyers. Twiggs Money Flow reflects this, failing to show any meaningful accumulation.
The Dow Industrial Average shows bearish increased volume on the last two days down-swing. Low volume during the rally over recent weeks indicates a lack of commitment from buyers. Twiggs Money Flow reflects this, failing to show any meaningful accumulation.
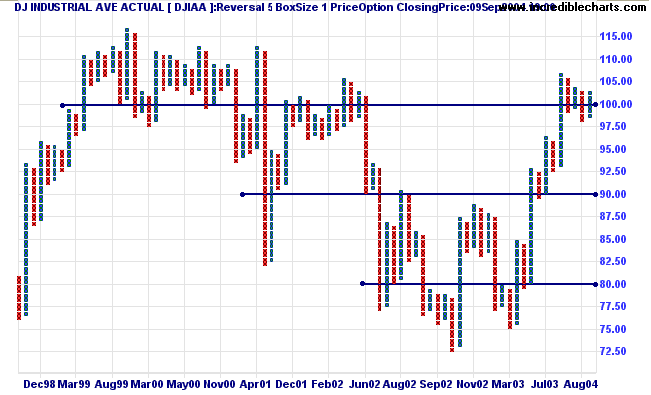
The point and figure chart below reflects the long-term trend
(box size 1, reversal 5). The recent consolidation pattern around
10000 reflects market uncertainty. A trough above 10000 would be
a bullish sign, while a peak below this level would be bearish.
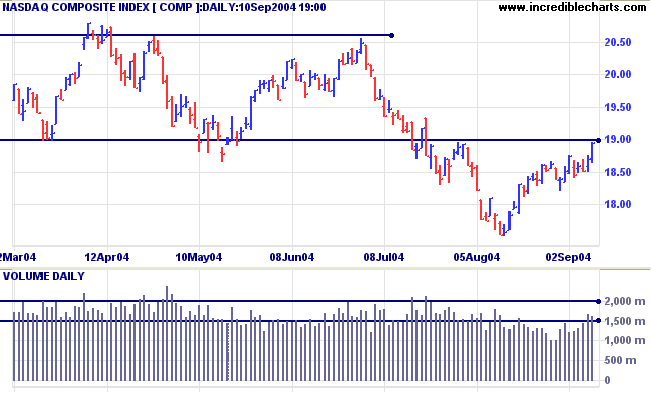
The Nasdaq Composite primary trend is headed downward. The
latest rally is testing resistance at 1900, though low volume
indicates that resistance will most likely hold.
Twiggs Money Flow fails to reflect significant accumulation.
Twiggs Money Flow fails to reflect significant accumulation.
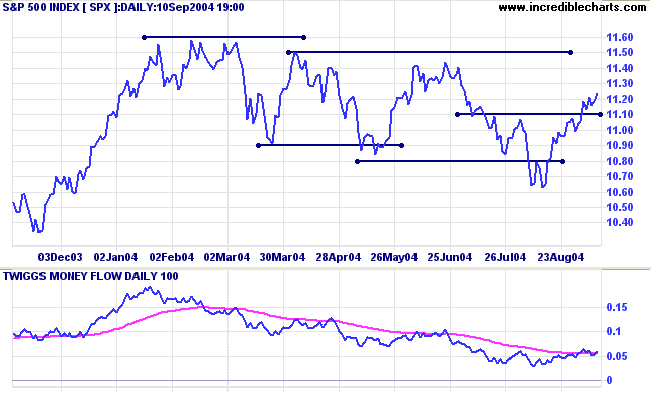
The S&P 500 appears headed for a test of resistance at
1150. Low volume in recent weeks signals a lack of commitment
from buyers, with a successful upward breakout unlikely at this
stage. The consolidation pattern continues.
A trough above 1100 would be a bullish sign, while a peak below 1100 would be bearish.
Twiggs Money Flow shows signs of improvement, crossing to above the signal line.
A trough above 1100 would be a bullish sign, while a peak below 1100 would be bearish.
Twiggs Money Flow shows signs of improvement, crossing to above the signal line.
NYSE Bullish Percent
The NYSE Bullish Percent Index rose to 59.24%, close to the start of a bear correction.
The NYSE Bullish Percent Index rose to 59.24%, close to the start of a bear correction.
|
|
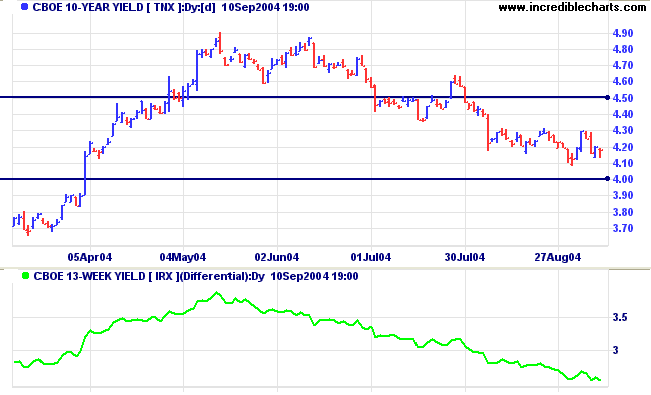
Treasury yields
The yield on 10-year treasury notes is consolidating above 4.00%.
Market expectations are for a quarter per cent rise at the Fed's September 21 meeting.
The yield differential (10-year T-notes minus 13-week T-bills) eased to 2.6%.
Low differentials (below 1.0%) are generally bear signals.
The yield on 10-year treasury notes is consolidating above 4.00%.
Market expectations are for a quarter per cent rise at the Fed's September 21 meeting.
The yield differential (10-year T-notes minus 13-week T-bills) eased to 2.6%.
Low differentials (below 1.0%) are generally bear signals.
Gold
New York: Spot gold continues to test support at $400, ending the week at $401.50.
Marginal new highs (May to August) indicate a lack of commitment from buyers.
New York: Spot gold continues to test support at $400, ending the week at $401.50.
Marginal new highs (May to August) indicate a lack of commitment from buyers.
|
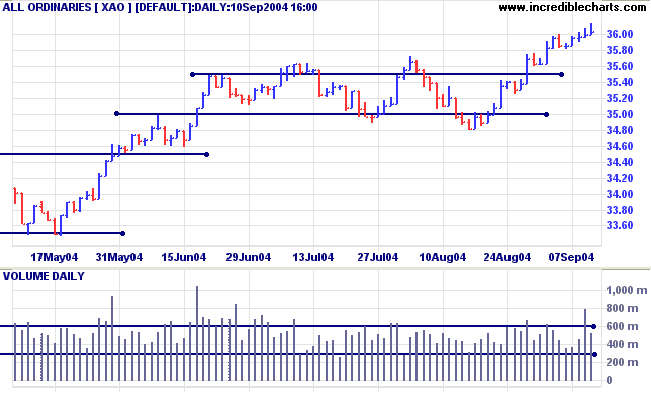
ASX Australia
Resistance is evident at 3600 on the All Ordinaries with successive weak closes on strong volume. So far buying support has prevented a down-swing. Expect a down-swing next week to test support levels.
Resistance is evident at 3600 on the All Ordinaries with successive weak closes on strong volume. So far buying support has prevented a down-swing. Expect a down-swing next week to test support levels.
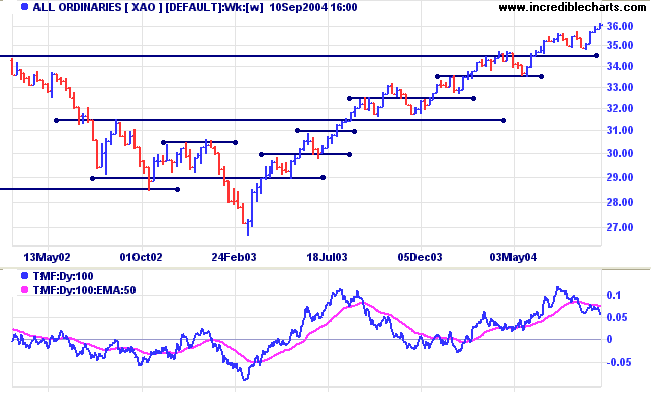
The All Ordinaries is in a primary up-trend,
though we can expect a re-test of support at 3450 in the next few
months.
Twiggs Money Flow is cause for concern: turning over below the signal line to signal distribution.
Twiggs Money Flow is cause for concern: turning over below the signal line to signal distribution.
Revised Troubleshooting
Pages
We have completely revised the Troubleshooting section of Incredible Charts, to offer detailed assistance with
We have completely revised the Troubleshooting section of Incredible Charts, to offer detailed assistance with
- installation;
- live updates;
- firewalls;
|
For assistance with your firewall see: |
- Internet Explorer;
- ad-blocking software;
- dial-up connections; and
- Windows XP Service Pack 2.
About
the Trading Diary has been expanded to offer further
assistance to readers.
Colin Twiggs
Markets are constantly in a state of uncertainty and flux
and money is made by discounting the obvious
and betting on the unexpected.
~ George Soros
and money is made by discounting the obvious
and betting on the unexpected.
~ George Soros
Back Issues
Click here to access the Trading Diary Archives.
Click here to access the Trading Diary Archives.
Back Issues
Access the Trading Diary Archives.