NYSE Bullish Percent
The NYSE Bullish Percent Index has fallen to 59.31%, giving a strong bear signal.
The NYSE Bullish Percent Index has fallen to 59.31%, giving a strong bear signal.
|
|
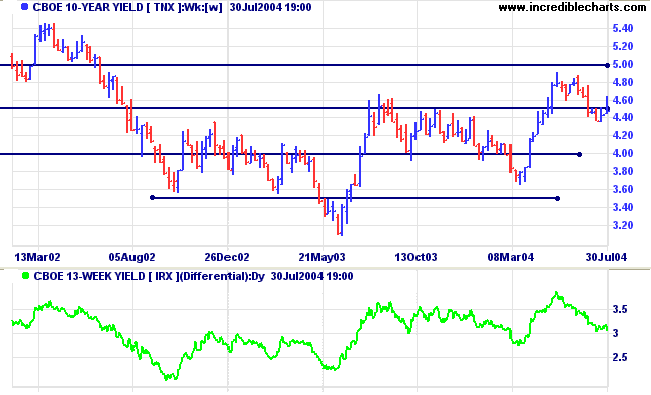
Treasury yields
The yield on 10-year treasury notes broke through resistance before retreating back below 4.50%. The yield is consolidating in a narrow range below this level; a breakout below the pattern would signal a re-test of support at 3.50%.
The yield differential (10-year T-notes minus 13-week T-bills) is healthy at 3.0%.
Gold
New York: Spot gold has recovered to just above $390.00. The metal still appears headed for a test of support at $375.00.
New York: Spot gold has recovered to just above $390.00. The metal still appears headed for a test of support at $375.00.
|
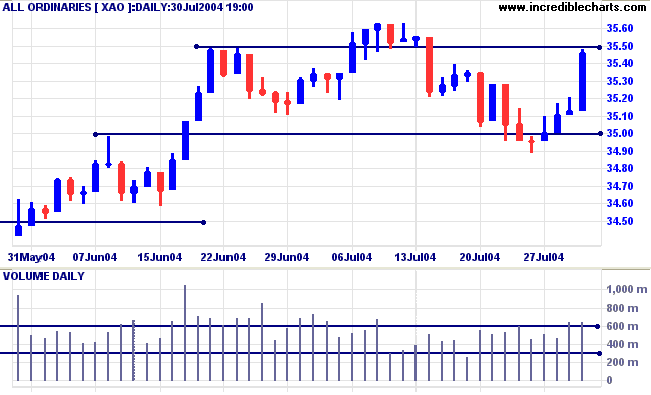
ASX Australia
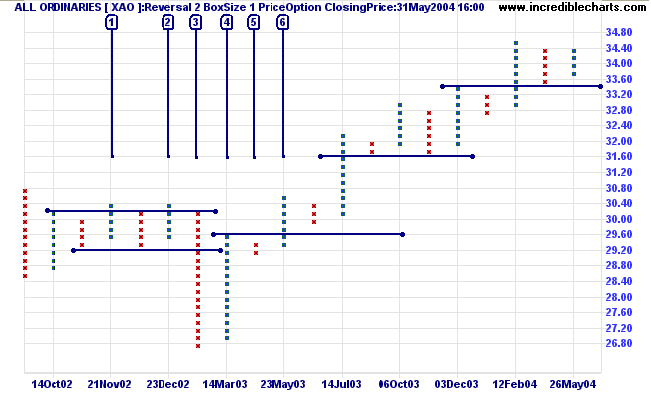
The All Ordinaries made a false break below support at 3500 before rallying on strong volume. The index is still in a consolidation pattern. An upward breakout, followed by a pull-back that respects support at 3550, would confirm the up-trend.
The All Ordinaries made a false break below support at 3500 before rallying on strong volume. The index is still in a consolidation pattern. An upward breakout, followed by a pull-back that respects support at 3550, would confirm the up-trend.
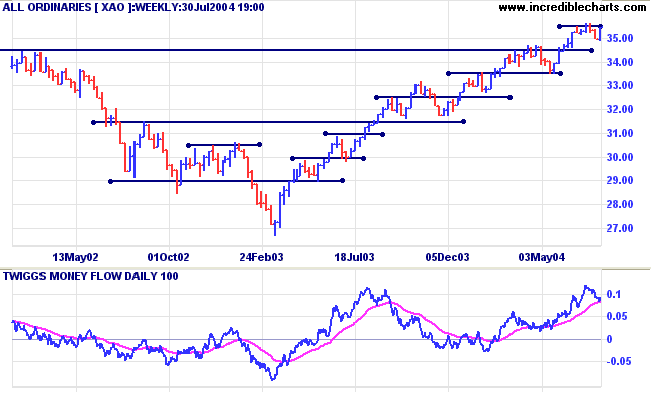
A secondary correction or a consolidation that
respects support at the previous high of 3450 will be a
long-term bull signal.
A fall below 3350 would be a bear signal, indicating reversal of the primary trend.
Twiggs Money Flow continues to signal accumulation.
A fall below 3350 would be a bear signal, indicating reversal of the primary trend.
Twiggs Money Flow continues to signal accumulation.
Point & Figure - Retracements
Retracements (or corrections) during a trend tell us about the strength of that trend. They test the strength of buyers' or sellers' commitment and establish a base for further gains (or losses). There are four major categories:
Long Retracements
A long retracement signals trend weakness, especially when it follows a spike.
Retracements (or corrections) during a trend tell us about the strength of that trend. They test the strength of buyers' or sellers' commitment and establish a base for further gains (or losses). There are four major categories:
- long retracement
- overlapping retracement
- short retracement
- no retracement - during an upward/downward spike.
Long Retracements
A long retracement signals trend weakness, especially when it follows a spike.
-
Higher prices after an upward spike may be
unsustainable.
Be on the alert for a short reaction followed by a change of trend. - The same applies to a long retracement following a downward spike: lower prices may be unsustainable.
Overlapping Retracements
Retracements may overlap either partially or completely:
Retracements may overlap either partially or completely:
-
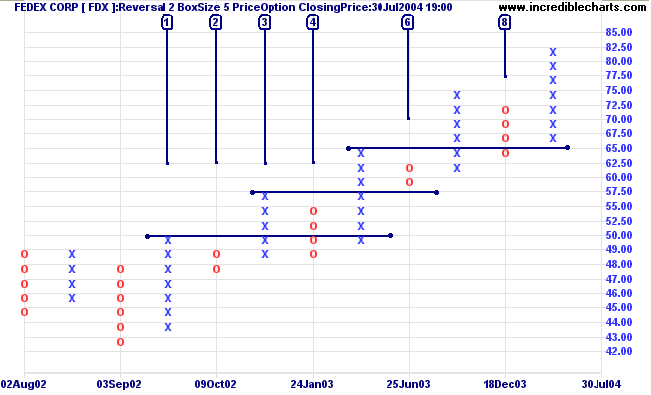
Partial overlaps indicate a slow but
generally stable up-trend.
On the Fedex chart below the retracement at [4] breaks through the first line of support, from the high of [1], and overlaps with column [2], indicating a slow up-trend. - Complete overlaps form equal lows in an up-trend (or equal highs in a down-trend) and generally indicate consolidation, establishing a base for further gains.
Next week - short retracements.
About
the Trading Diary has been expanded to offer further
assistance to readers, including directions on how to search the
archives.
Colin Twiggs
Often people attempt to live their life backwards:
They try to have more things, or more money,
in order to do more of what they want,
so that they will be happier.
The way it actually works is the reverse.
You must first be who you really are,
then do what you need to do,
in order to have what you want.
~ Shakti Gawain: Creative Visualization
They try to have more things, or more money,
in order to do more of what they want,
so that they will be happier.
The way it actually works is the reverse.
You must first be who you really are,
then do what you need to do,
in order to have what you want.
~ Shakti Gawain: Creative Visualization
Back Issues
Click here to access the Trading Diary Archives.
Click here to access the Trading Diary Archives.
Back Issues
Access the Trading Diary Archives.