|
S&P 500 [SPX] data history |
|
The S&P 500 data history has been extended to 24
years |
Trading Diary
June 12, 2004
These extracts from my daily trading diary
are for educational purposes
and should not be interpreted as investment
advice. Full terms and conditions can be found at Terms
of Use.
USA
The Dow Industrial Average rally appears healthy, with
short retracements on low volume. However, declining overall
volume raises doubt about buyers ability to break through
resistance at 10570. Failure to do so would signal a re-test of
support at 10000/9900.
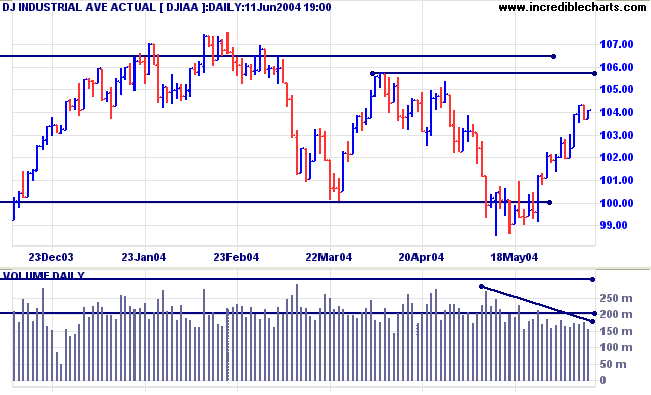
A rise above 10570 would signal resumption of the primary
up-trend.
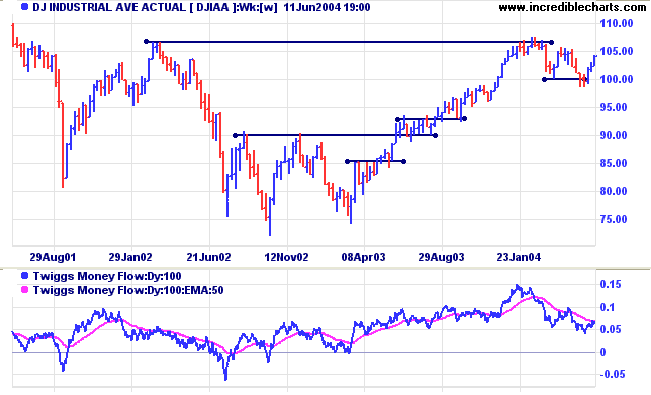
But Twiggs Money Flow continues to signal distribution.
But Twiggs Money Flow continues to signal distribution.
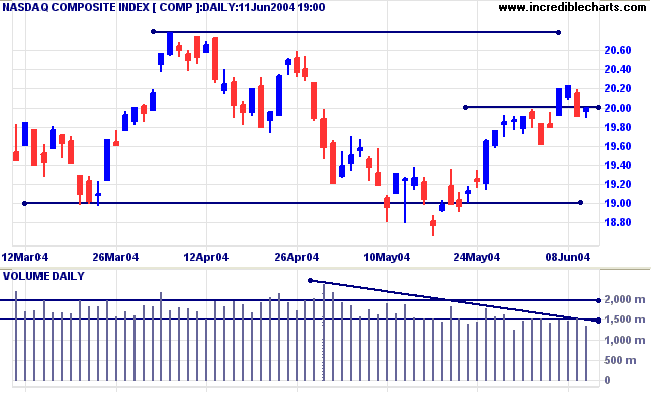
The Nasdaq Composite broke through resistance at 2000 but
has since retreated below this level.
Declining volume signals a lack of commitment from buyers.
Twiggs Money Flow continues to show distribution.
Declining volume signals a lack of commitment from buyers.
Twiggs Money Flow continues to show distribution.
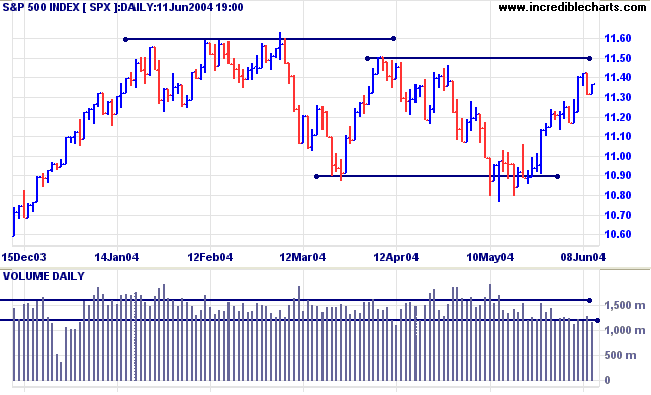
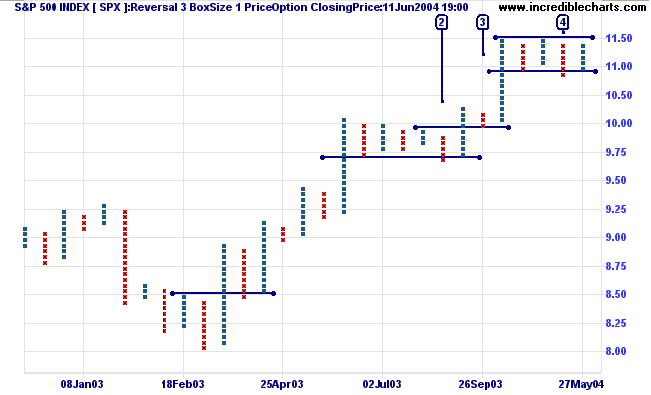
The S&P 500 has also experienced low volumes on the
latest rally. Failure to break above resistance at 1150 will
signal another test of support at 1090/1080.
A bear trap pattern is evident at [4] on the P&F chart
below.
A clear break above resistance at 1150 would signal resumption of the primary up-trend; though it may be advisable to wait for confirmation, as at [3] on the last breakout.
Twiggs Money Flow continues to signal distribution.
A clear break above resistance at 1150 would signal resumption of the primary up-trend; though it may be advisable to wait for confirmation, as at [3] on the last breakout.
Twiggs Money Flow continues to signal distribution.
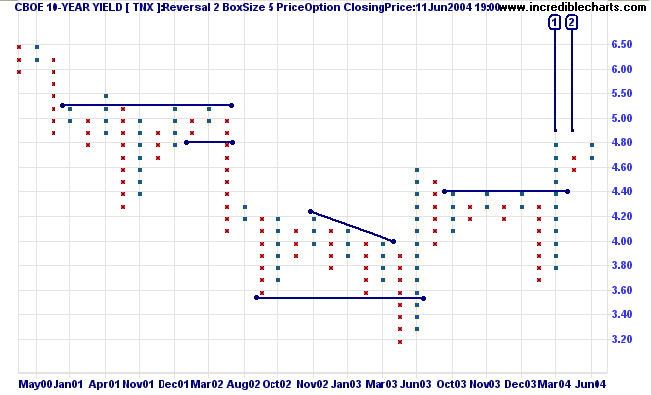
Treasury yields
The yield on 10-year treasury notes is at 4.791%. The short retracement [2] after the breakout [1] above resistance indicates a healthy primary up-trend.
The yield differential (10-year T-notes minus 13-week T-bills) at 3.5% reflects imminent rates increases.
The yield on 10-year treasury notes is at 4.791%. The short retracement [2] after the breakout [1] above resistance indicates a healthy primary up-trend.
The yield differential (10-year T-notes minus 13-week T-bills) at 3.5% reflects imminent rates increases.
Gold
New York: Spot gold closed down at $384.90, below resistance at 390. Expect a bearish consolidation or slow down-trend.
The next (intermediate) support level is at the May low of 375.
New York: Spot gold closed down at $384.90, below resistance at 390. Expect a bearish consolidation or slow down-trend.
The next (intermediate) support level is at the May low of 375.
Incredible Charts - now with US
Data
|
FREE trial - Click Here
ASX Australia
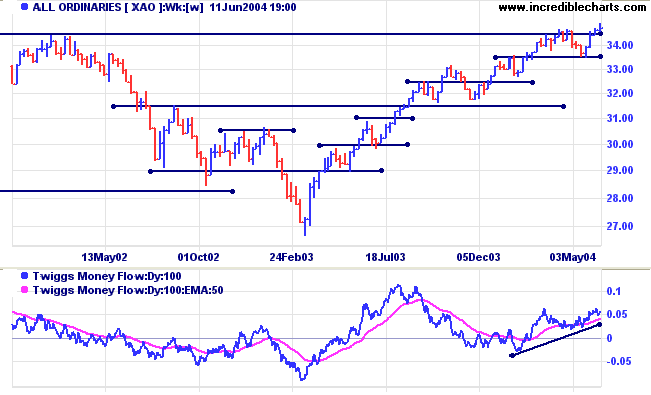
The All Ordinaries rallied to a new high
but quickly reversed on increased volume. Buyers then
intervened, overcoming sellers on strong volume at [4], but the
action seems to have exhausted demand: volume dropped
significantly on Friday.
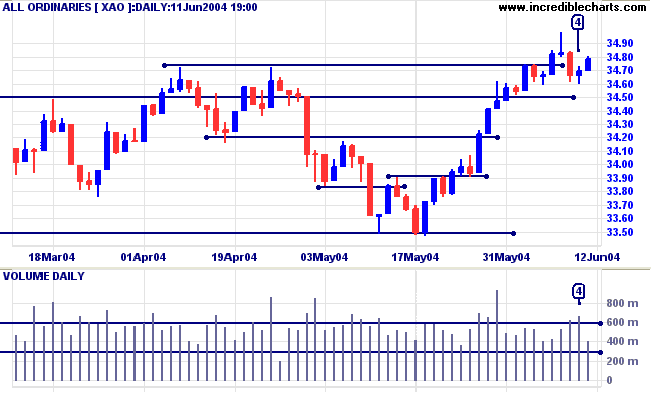
While Twiggs Money Flow shows signs of
increasing accumulation, we have not yet seen confirmation of the
breakout, in the form of a pull-back that respects the new
support level.
Point & Figure - Bull and Bear
Traps
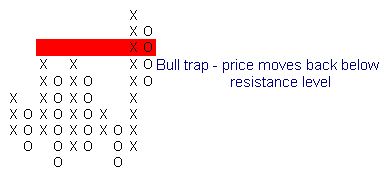
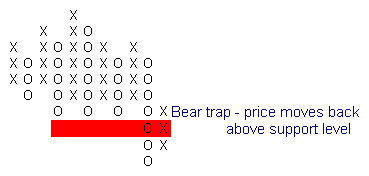
One of the most reliable patterns. Bull traps occur when an upward breakout retreats back below a resistance level. Bear traps occur when a downward breakout retreats back above a support level.
Bull Traps
One of the most reliable patterns. Bull traps occur when an upward breakout retreats back below a resistance level. Bear traps occur when a downward breakout retreats back above a support level.
Bull Traps
- Bull traps should be traded in a down-trend.
- They may also signal reversal after an extended up-trend.
- Go short when price falls back below the resistance level.
Bear Traps
More on triangle patterns next week....
Back Issues
- Bear traps should be traded in an up-trend.
- They may also signal reversal after an extended down-trend.
- Go long when price rises above the support level.
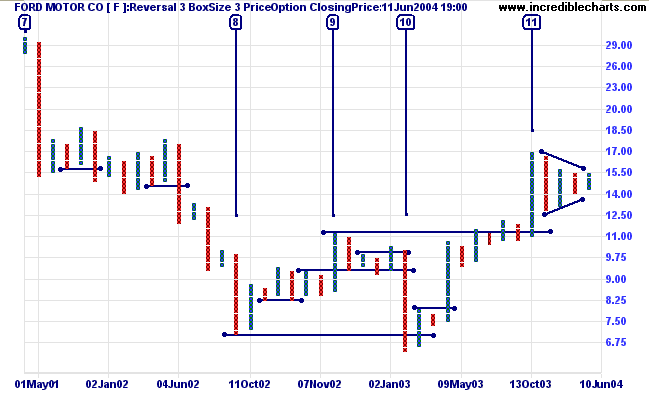
Wide Bull and Bear traps
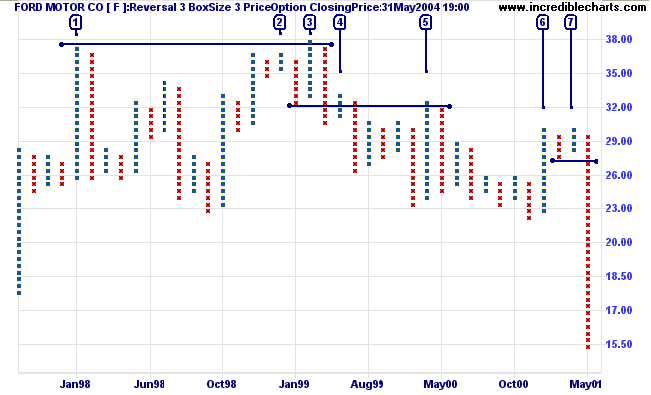
Bull and bear traps (and false breaks) often occur in longer time frames as well.
Ford Motor Co. displays a bull trap that took more than a year to complete.
Bull and bear traps (and false breaks) often occur in longer time frames as well.
Ford Motor Co. displays a bull trap that took more than a year to complete.
- Price spikes up to a new high, in early 1998, but quickly retraces.
- Resistance forms just below the previous high. The strong following correction is a bearish sign.
- The Bull trap: Price rallies to a marginal new high but then retreats below the resistance level.
- A short retracement confirms the trend change.
- An equal lower high confirms resistance has formed at 32.00: the low before [3]. A strong bear signal.
- Another attempted rally peters out.
- Equal highs in a down-trend are a strong bear signal; and are followed by a long downward spike.
More on triangle patterns next week....
Basic point and figure chart patterns are explained at the
Trading Guide: P&F Chart Patterns.
About
the Trading Diary has been expanded to offer further
assistance to readers, including directions on how to search
the archives.
Colin Twiggs
The usual bull market successfully weathers
a number of testsuntil it is
considered invulnerable,
whereupon it is ripe for a bust.
~ George Soros
whereupon it is ripe for a bust.
~ George Soros
Back Issues
Click here to access the Trading Diary Archives.
Click here to access the Trading Diary Archives.
Back Issues
Access the Trading Diary Archives.