|
Backup Data Files |
|
Watchlists and project files are stored on your
computer. |
Trading Diary
May 29, 2004
These extracts from my daily trading diary
are for educational purposes
and should not be interpreted as investment
advice. Full terms and conditions can be found at Terms
of Use.
USA
The Dow Industrial Average, contrary to previous
indications, made an upward breakout from the two-week
consolidation. The up-swings at [1] and [3] show strong momentum,
while subsequent retracements are short and on lower volume:
indicating a fast intermediate trend. We are likely to see a test
of resistance at 10570, the April high. Declining overall volume
indicates that the fast up-trend is unlikely to break above this
level.
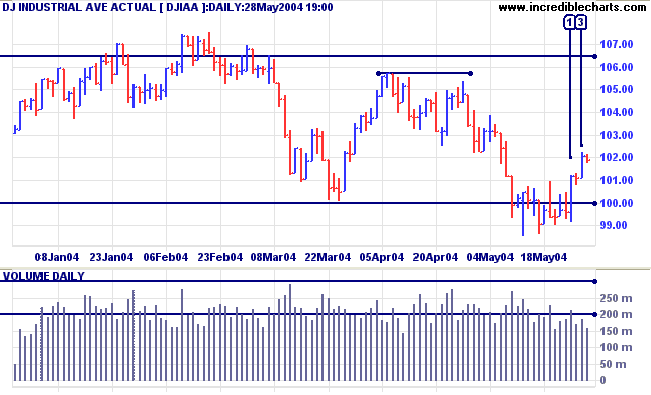
A clear break above 10570 would signal resumption of the primary
up-trend. Failure to break above this level would be a strong
bear signal. A close below 9900 would indicate a test of support
at 9000.
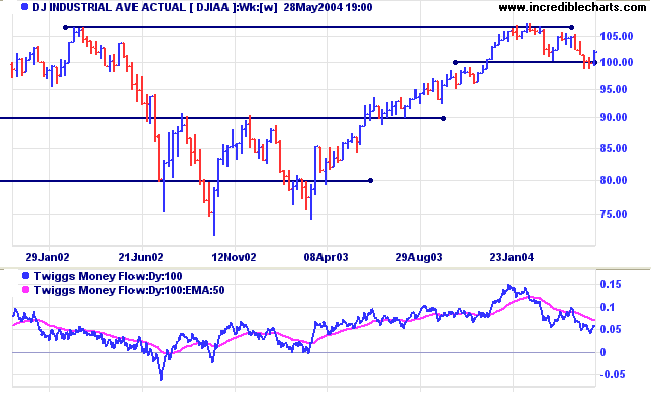
Twiggs Money Flow continues to signal distribution.
Twiggs Money Flow continues to signal distribution.
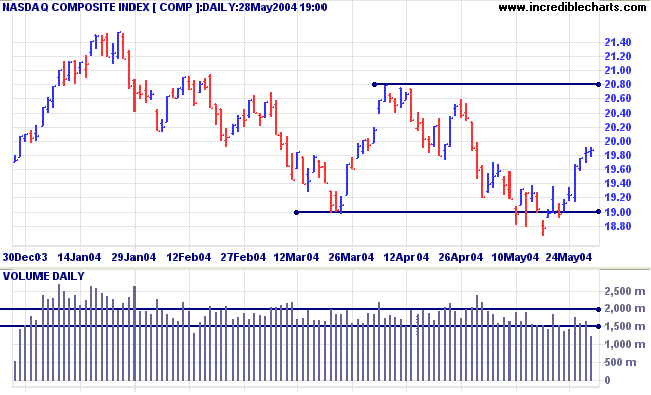
The Nasdaq Composite appears headed for a test of
resistance at 2080. Declining volume makes it likely that the
index will respect this level.
Twiggs Money Flow continues to display a strong bear signal.
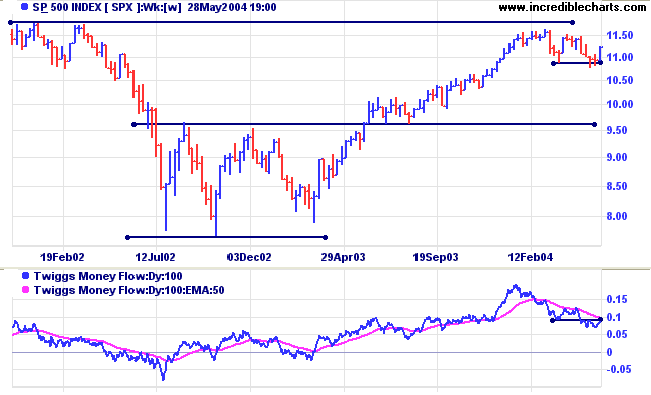
The S&P 500 is in a fast intermediate up-trend.
Friday's inside day on low volume is unlikely to reverse this.
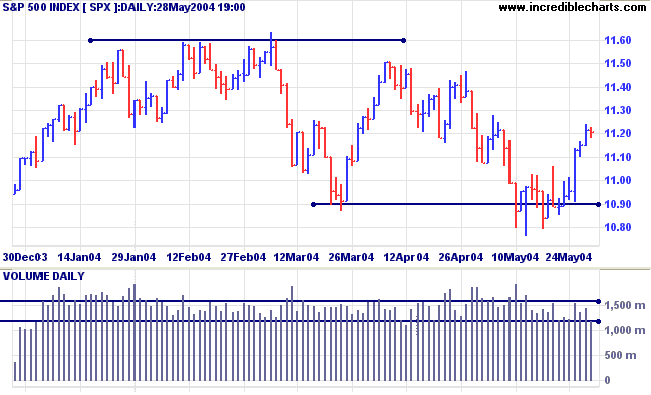
A clear break above resistance at 1150 will signal resumption of
the primary up-trend. Failure to break above this level will be a
strong bear signal.
Twiggs Money Flow continues to signal distribution.
Twiggs Money Flow continues to signal distribution.
NYSE Bullish Percent Index
The Chartcraft Bullish Percent Index is on Bear Alert status, having recovered slightly to 60.98%.
The Chartcraft Bullish Percent Index is on Bear Alert status, having recovered slightly to 60.98%.
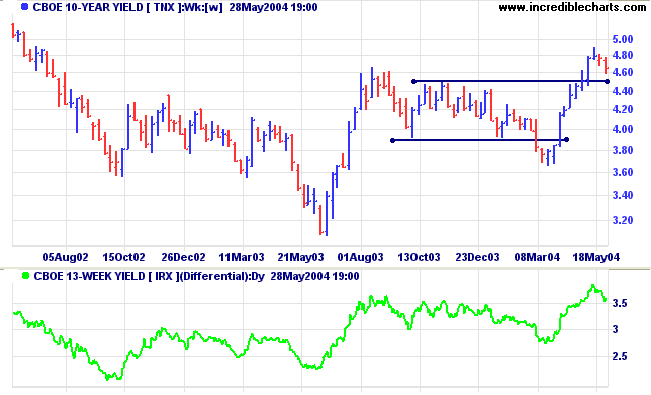
Treasury yields
The yield on 10-year treasury notes has retraced to 4.655%. A correction that respects support at 4.50% will confirm the strength of the primary up-trend.
The yield differential (10-year T-notes minus 13-week T-bills) at 3.6% reflects imminent rates increases.
The yield on 10-year treasury notes has retraced to 4.655%. A correction that respects support at 4.50% will confirm the strength of the primary up-trend.
The yield differential (10-year T-notes minus 13-week T-bills) at 3.6% reflects imminent rates increases.
Gold
New York: Spot gold has recovered to $393.70, above resistance at 390. This does not indicate a change in trend; the primary trend continues downwards; but it does increase uncertainty. A pull-back that respects support at 390 would signal a likely re-test of resistance at the previous 2004 highs. A fall through support at 390 would indicate a bearish consolidation or slow down-trend.
New York: Spot gold has recovered to $393.70, above resistance at 390. This does not indicate a change in trend; the primary trend continues downwards; but it does increase uncertainty. A pull-back that respects support at 390 would signal a likely re-test of resistance at the previous 2004 highs. A fall through support at 390 would indicate a bearish consolidation or slow down-trend.
Incredible Charts - now with US
Data
|
FREE trial - Click Here
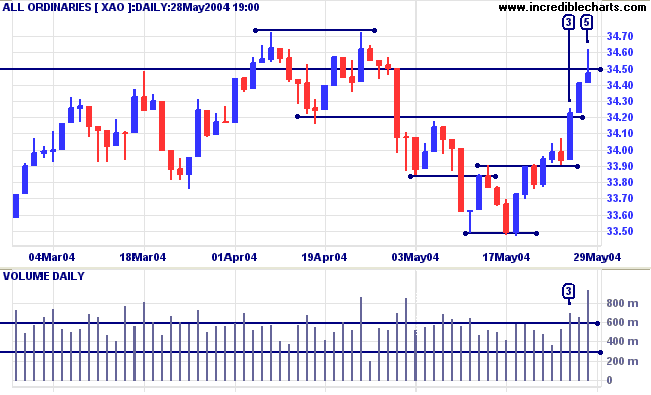
ASX Australia
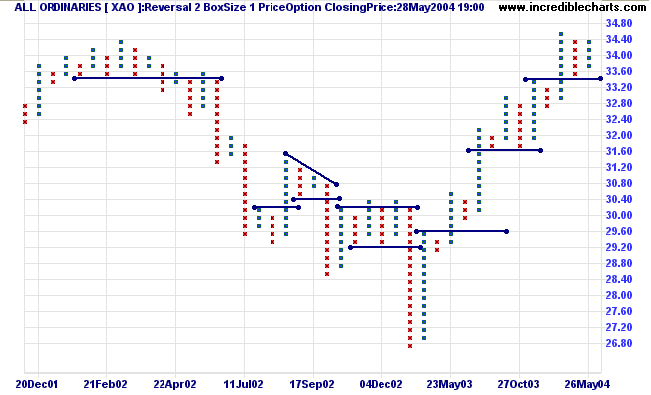
The All Ordinaries consolidated above
the new support level of 3390 for two days before breaking
upwards on strong volume at [3]. The index rallied swiftly
to [5] before encountering resistance at 3450. The weak
close and very heavy volume indicate strong selling pressure and
we may see a pull-back.
If the index is able to overcome resistance at 3450 this will be a strong bull signal. Failure to do so may result in consolidation between 3350 and 3450.
If the index is able to overcome resistance at 3450 this will be a strong bull signal. Failure to do so may result in consolidation between 3350 and 3450.
The importance of support at 3350 can be
clearly seen on the point and figure chart below. A break below
this level will be a strong bear signal. Though, in terms of Dow
Theory, only a fall below 3150 (3160 on the chart below) will
signal reversal of the primary trend.
Twiggs Money Flow (not shown) continues to display a bearish divergence.
Twiggs Money Flow (not shown) continues to display a bearish divergence.
Point & Figure Chart Patterns
Basic point and figure chart patterns are explained at the Trading Guide: P&F Chart Patterns.
Basic point and figure chart patterns are explained at the Trading Guide: P&F Chart Patterns.
- Support and resistance;
- Trendlines;
- Breakouts;
- Bull and Bear signals; and
- Bull and Bear traps.
Spikes
An upward spike, where a rally exceeds the previous column of Xs by a large number: at least 10 boxes or 10% of the starting price. This is a signal to take profits: spikes can reverse sharply and there is nothing worse than seeing those hard-earned profits disappearing before your eyes.
An upward spike, where a rally exceeds the previous column of Xs by a large number: at least 10 boxes or 10% of the starting price. This is a signal to take profits: spikes can reverse sharply and there is nothing worse than seeing those hard-earned profits disappearing before your eyes.
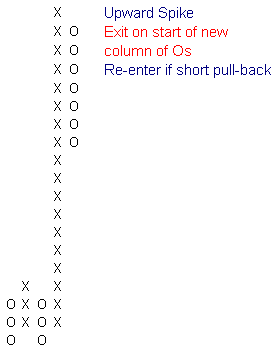
Occasionally you will be lucky enough to experience two spikes in
succession; so be on the lookout for a short pull-back (no more
than say 3 boxes). Re-enter on the start of a new column of Xs,
but keep stops tight.
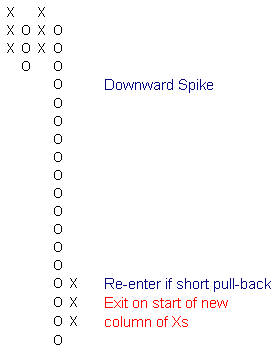
Thomas Dorsey (Point & Figure Charting) mentions a long tail down pattern, where a single column of Os is 20 or more boxes, which he uses as a buy signal. I would not be that adventurous. I suspect that successive downward spikes are more common (than successive upward spikes). If, however, a column of Os exceeds the previous trough by at least 10 boxes (or 10% of price), it is clearly a signal to take profits on short positions. Exit on the start of a new column of Xs. Re-enter if there is a short retracement.
Thomas Dorsey (Point & Figure Charting) mentions a long tail down pattern, where a single column of Os is 20 or more boxes, which he uses as a buy signal. I would not be that adventurous. I suspect that successive downward spikes are more common (than successive upward spikes). If, however, a column of Os exceeds the previous trough by at least 10 boxes (or 10% of price), it is clearly a signal to take profits on short positions. Exit on the start of a new column of Xs. Re-enter if there is a short retracement.
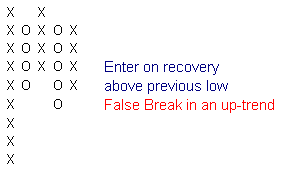
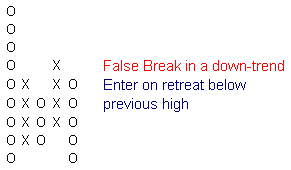
False breaks
Similar to bull and bear traps, false breaks should be sought in an established trend.
In an up-trend, if price falls below the previous low by only a small margin (normally only one box) and then promptly reverses upwards, buy on recovery above the previous low. This is one weakness with point and figure charts: you will not see the recovery until price has increased by the reversal amount.
The same applies to down-trends: if price rises above the
previous high by a small margin and then promptly reverses, buy
on the retreat below the previous high.
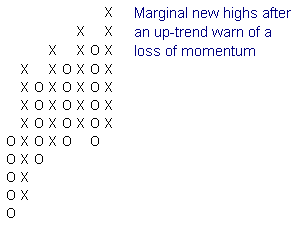
Loss of Momentum
After an up-trend, marginal new highs (especially where accompanied by equal or lower lows) indicate a loss of momentum and may evolve into a stage 3 top.
After an up-trend, marginal new highs (especially where accompanied by equal or lower lows) indicate a loss of momentum and may evolve into a stage 3 top.
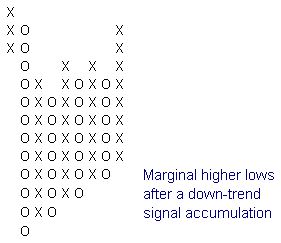
Marginal Higher Lows
In a down-trend, a series of higher lows indicate accumulation. Equal or rising highs are a further bullish sign. Enter on completion of the third higher low: the start of the fourth column of Xs.
In a down-trend, a series of higher lows indicate accumulation. Equal or rising highs are a further bullish sign. Enter on completion of the third higher low: the start of the fourth column of Xs.
About
the Trading Diary has been expanded to offer further
assistance to readers, including directions on how to search the
archives.
Colin Twiggs
Whatever failures I have known, whatever errors
I have committed,
whatever follies I have witnessed in private and public life
have been the consequence of action without thought.
~ Bernard Baruch
whatever follies I have witnessed in private and public life
have been the consequence of action without thought.
~ Bernard Baruch
Back Issues
Click here to access the Trading Diary Archives.
Click here to access the Trading Diary Archives.
Back Issues
Access the Trading Diary Archives.