|
Incredible Charts version 4.0.3.200 |
|
A new version is now available. Incredible
Charts should automatically update when you login. You may
be prompted to adjust your firewall permissions to include
IP address 69.28.204.30. The new version addresses encryption issues encountered by some users and increases the number of Keyboard shortcuts. Click Help >> About to check whether you have received the update. |
Trading Diary
May 1, 2004
These extracts from my daily trading diary
are for educational purposes
and should not be interpreted as investment
advice. Full terms and conditions can be found at Terms
of Use.
USA
The Dow Industrial Average intermediate trend is drifting
lower. Support at 10250 has been penetrated, completing a bearish
double top. But light volume and a weak close indicate a lack of
momentum.
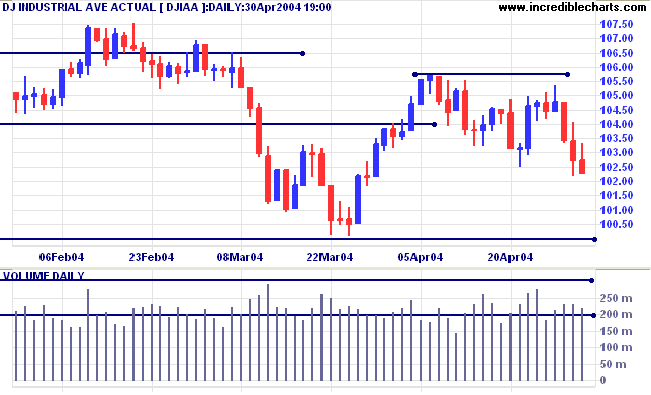
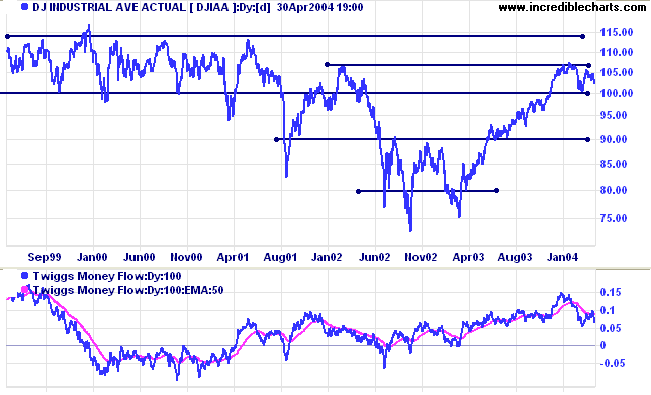
The primary trend is up. There is no strong momentum on the
latest secondary correction. At this stage it appears that
support at 10000 will hold.
Twiggs Money Flow has crossed back below its signal line. A fall below the March 24 low would be a strong bear signal.
Twiggs Money Flow has crossed back below its signal line. A fall below the March 24 low would be a strong bear signal.
The Nasdaq Composite is testing support at 1900. A fall
below this level will signal a strong secondary reaction but not
necessarily reversal of the primary trend.
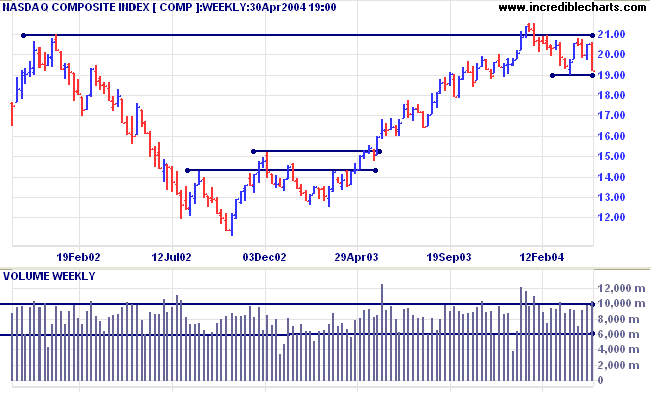
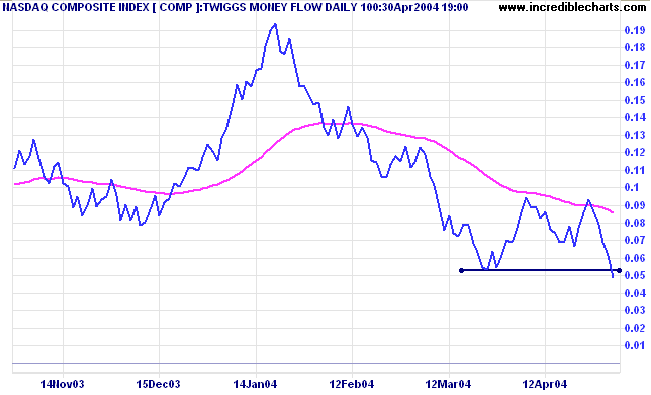
Twiggs Money Flow has fallen below the March 24 low, giving a
strong bear signal.
The S&P 500 respected resistance at 1150 before
falling through short-term support (at 1115) on strong volume.
The intermediate trend is drifting lower and we are likely to see
a test of support at 1090/1087.
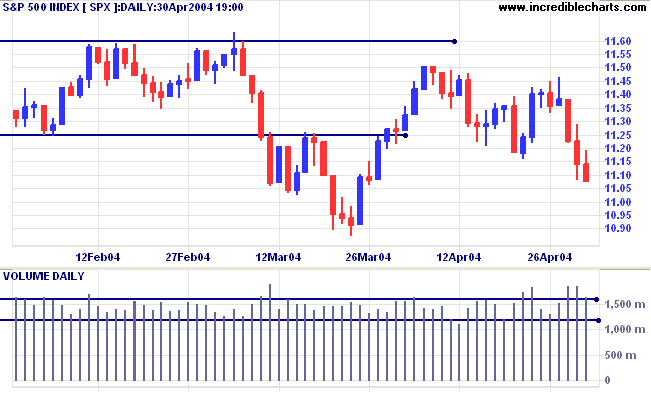
A fall below 1087 would not signal a primary trend reversal:
primary support is at 960.
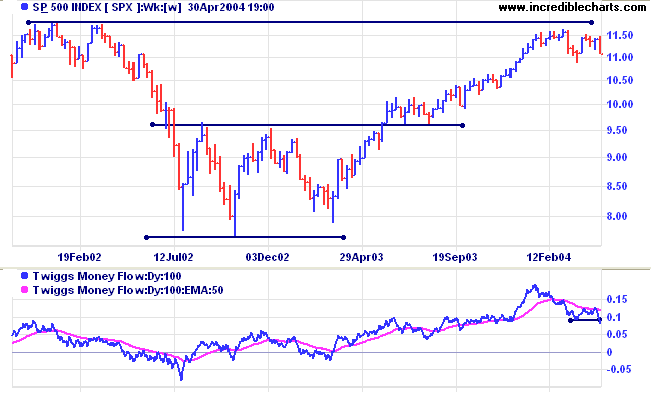
Twiggs Money Flow, however, has fallen to a new 3-month low - a strong bear signal.
Twiggs Money Flow, however, has fallen to a new 3-month low - a strong bear signal.
NYSE Bullish Percent Index
The Chartcraft Bullish Percent Index has retreated to 71.02%. A fall below 70 will signal a Bear Alert.
The Chartcraft Bullish Percent Index has retreated to 71.02%. A fall below 70 will signal a Bear Alert.
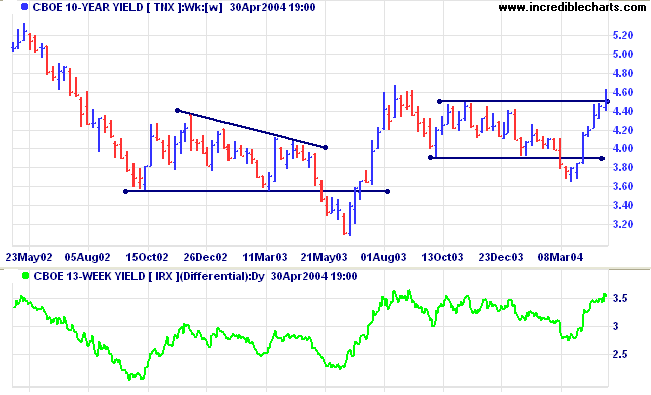
Treasury yields
The yield on 10-year treasury notes broke through resistance at 4.50%, signaling the start of a primary up-trend. This has been followed by a pull-back to test the new support level. A rise above 4.67% would add further confirmation of the trend change.
The yield differential (10-year T-notes minus 13-week T-bills) is a healthy 3.5%; with long-term investors demanding a healthy premium for tying up their capital.
Gold
New York: Spot gold has fallen to $386.80, breaking through support at 390 and signaling reversal of the primary trend.
New York: Spot gold has fallen to $386.80, breaking through support at 390 and signaling reversal of the primary trend.
Incredible Charts - now with US
Data
|
FREE trial - Click Here
ASX Australia
The All Ordinaries completed a small double top
with a fall below 3420; a bearish sign. Friday's weak close and
big volume, however, signal strong buying support above
3375.
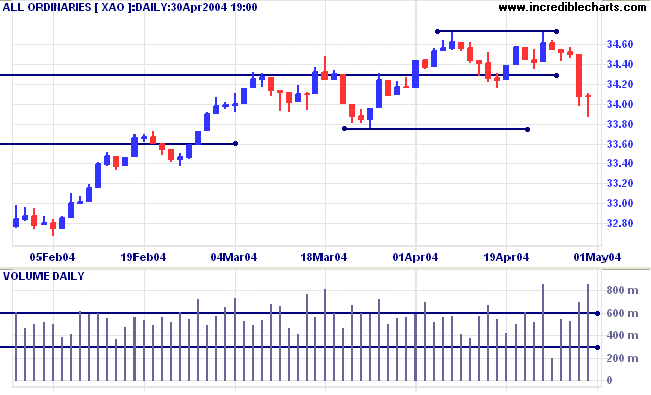
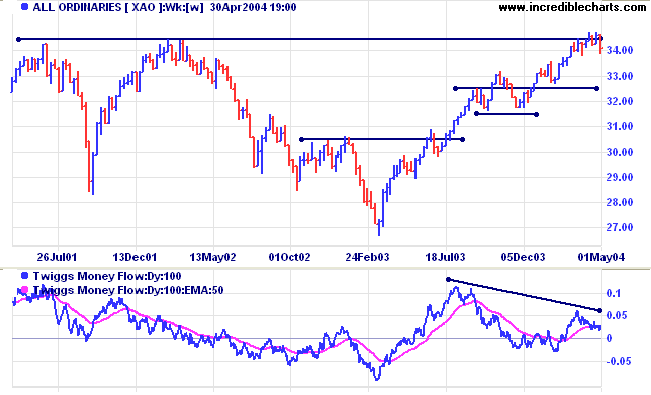
The primary trend is up. A fall below support at
3150 would signal reversal.
Twiggs Money Flow displays a bearish divergence, signaling long-term weakness.
Twiggs Money Flow displays a bearish divergence, signaling long-term weakness.
Keyboard Shortcuts
Incredible Charts offers a number of shortcut keys to streamline charting operation. These work mainly with the Function keys, F1 to F12; so make sure that [F Lock] is activated on your keyboard. I have highlighted the most useful keys (in bold) below.
Incredible Charts offers a number of shortcut keys to streamline charting operation. These work mainly with the Function keys, F1 to F12; so make sure that [F Lock] is activated on your keyboard. I have highlighted the most useful keys (in bold) below.
Charting Module:
- F1 - Opens the online Help menu at Getting Started
- F2 - Securities >> Refresh Current Security from Server
- F3 - Securities >> Search By Code
- F4 - opens View menu
- F5 - opens File menu
- F6 - File >> Open Project >> Default project file
- F7 - View >> Price Daily
- F8 - View >> Price Weekly
- F9 - View >> Price Monthly
|
- F11 - File >> Save Chart as Image
- F12 - File >> Print
- Left Arrow - toolbar button: Scroll Back
- Right Arrow - toolbar button: Scroll Forward
|
- Up Arrow - toolbar button: Select Previous Security on Active Watchlist
- Down Arrow - toolbar button: Select Next Security on Active Watchlist
Stock Screens:
Back Issues
-
ENTER - Submit button on the Stock
Screen Input Page
- F1 - Opens online Help page at Stock Screening
- F2 - Refresh (Reload the Input Page) button
-
F3 - returns to the Stock Screen Input Page
-
F6 - Chart the Selected
Security
-
F7 - Create Watchlist
Automatically Adding Top 20 Securities
-
F8 - Create
Watchlist Automatically Adding All
Securities
- Left Arrow - stock screen results: Previous Page
- Right Arrow - stock screen results: Next Page
|
Display Part Periods
This question continually crops up: "How do I get the Weekly or Monthly charts to update daily instead of weekly or monthly?"
If you use weekly or monthly price bars or indicators, the chart will only adjust at the end of each completed week/month. To reflect the latest partially-completed period:
For this reason I use daily indicators wherever possible. For example, use a daily MACD with settings of 130, 60,45 instead of a weekly MACD with settings of 26,12,9. However, with indicators that use highs and lows, such as the Stochastic, daily and weekly trading ranges are completely different.
This question continually crops up: "How do I get the Weekly or Monthly charts to update daily instead of weekly or monthly?"
If you use weekly or monthly price bars or indicators, the chart will only adjust at the end of each completed week/month. To reflect the latest partially-completed period:
- select File >> Advanced Features >> Display Part-Periods
For this reason I use daily indicators wherever possible. For example, use a daily MACD with settings of 130, 60,45 instead of a weekly MACD with settings of 26,12,9. However, with indicators that use highs and lows, such as the Stochastic, daily and weekly trading ranges are completely different.
About the Trading Diary has been expanded to offer
further assistance to readers, including directions on how to
search the archives.
Colin Twiggs
After spending many years in Wall Street
and after making and losing millions of dollars
I want to tell you this: It never was my thinking that made the big money for me.
It always was my sitting.... My sitting tight!
~ Edwin Lefevre: Reminiscences of a Stock Operator (1923).
I want to tell you this: It never was my thinking that made the big money for me.
It always was my sitting.... My sitting tight!
~ Edwin Lefevre: Reminiscences of a Stock Operator (1923).
Back Issues
Click here to access the Trading Diary Archives.
Click here to access the Trading Diary Archives.
Back Issues
Access the Trading Diary Archives.