Except for the 30-day free trial, free end-of-day data will be
delayed by 18 hours in future. This means that the updates will
occur at 10.00 a.m. - suitable for training purposes but not
active trading.
Premium subscribers are unaffected by these
changes.
To find out more about premium subscriptions - see Incredible Offer.
Also, early US subscribers enjoy an extended free trial until
June 30 and will not be affected by the changes.
If your free trial expiry date is not correctly reflected (see
Help >> About), please contact members
support.
|
Free Data |
Trading Diary
April 10, 2004
These extracts from my daily trading diary
are for educational purposes
and should not be interpreted as investment
advice. Full terms and conditions can be found at Terms
of Use.
USA
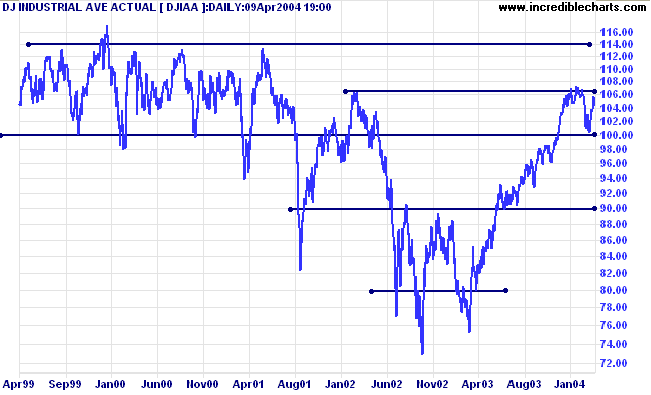
The Dow Industrial Average has pulled back to test support
at 10400.
An up-turn, without penetrating below the support level, would be a bullish sign. Failure to rise above the recent high of 10570 within the next, say, 10 days would be bearish.
An up-turn, without penetrating below the support level, would be a bullish sign. Failure to rise above the recent high of 10570 within the next, say, 10 days would be bearish.
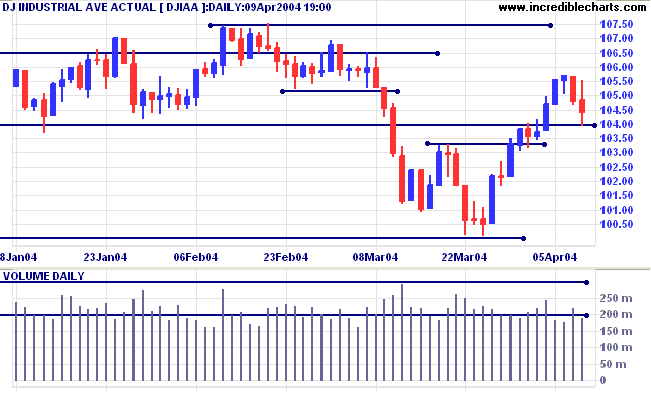
A break through resistance at 10700 to 10740 would signal
resumption of the primary up-trend and is likely to result in a
test of the 11400 level. Support is at 10000.
Twiggs Money Flow (not shown) is still bearish, below it's signal line.
Twiggs Money Flow (not shown) is still bearish, below it's signal line.
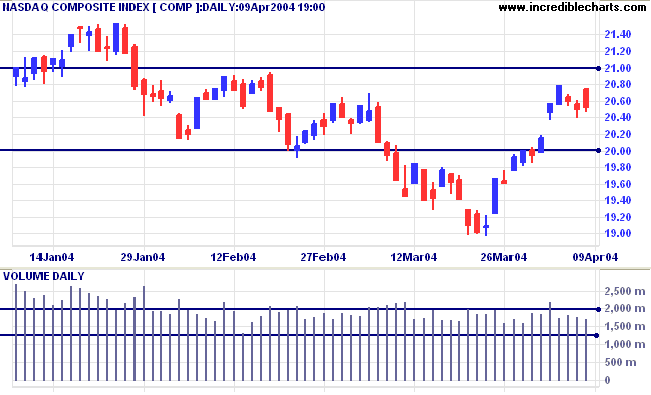
The Nasdaq Composite has consolidated after last week's
gap up on strong volume. Short-term resistance is at 2080 and
support at 2040. The intermediate trend is up and we are more
likely to see an upward breakout, testing resistance at
2100.
A rise above 2150 would signal resumption of the primary up-trend. Expect support at 2000 and 1900 (major).
Twiggs Money Flow (not shown) is bearish.
A rise above 2150 would signal resumption of the primary up-trend. Expect support at 2000 and 1900 (major).
Twiggs Money Flow (not shown) is bearish.
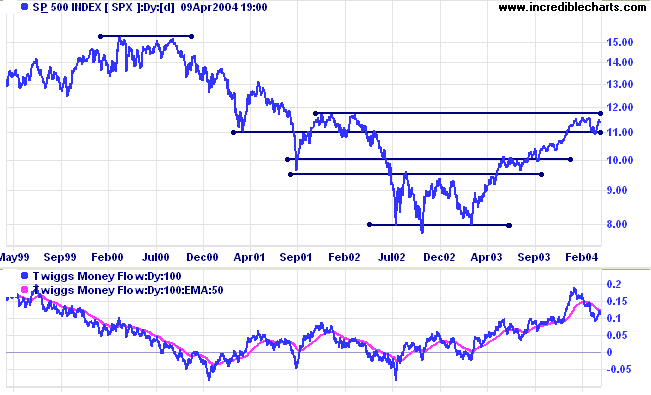
The S&P 500 signals indecision with a wide-ranging day
on low volume. Penetration of support at 1125 would be a bearish
sign; a rise above 1160 would be bullish.
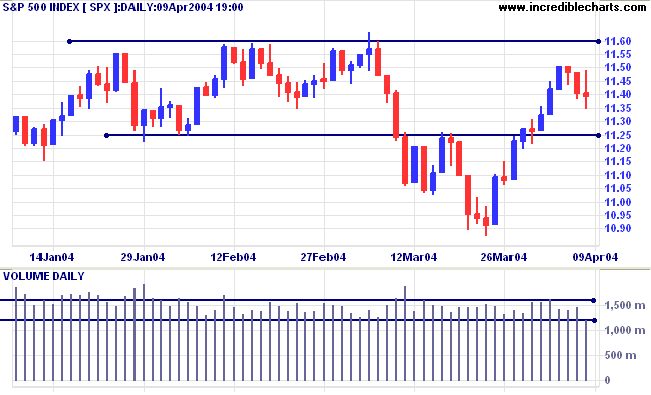
The primary trend is up.
Twiggs Money Flow is bearish, below its signal line.
Twiggs Money Flow is bearish, below its signal line.
Treasury yields
The yield on 10-year treasury notes closed at 4.197%.
The narrow range indicates a consolidation below resistance, increasing the likelihood of a continuation (above 4.25%).
The primary trend is uncertain.
The yield on 10-year treasury notes closed at 4.197%.
The narrow range indicates a consolidation below resistance, increasing the likelihood of a continuation (above 4.25%).
The primary trend is uncertain.
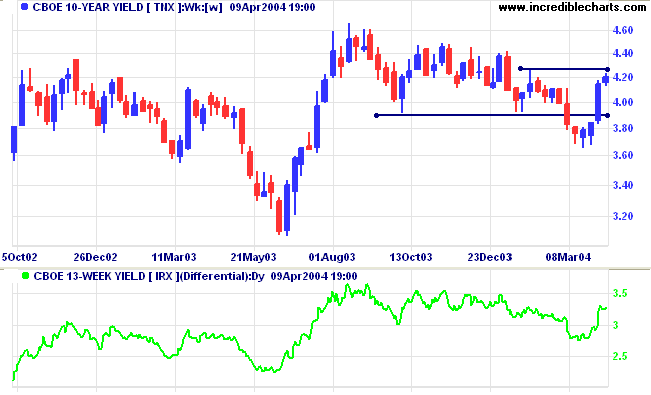
The
yield differential (10-year T-notes minus 13-week T-bills)
rose to a healthy 3.3%.
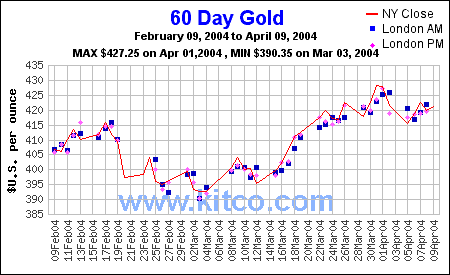
Gold
New York: Spot gold closed at $420.80 with the metal consolidating between $415 and $430 over the last 2 weeks.
The intermediate trend is up. A fall below $415 would indicate a reversal.
The primary trend is up. A fall below $390 would signal reversal.
New York: Spot gold closed at $420.80 with the metal consolidating between $415 and $430 over the last 2 weeks.
The intermediate trend is up. A fall below $415 would indicate a reversal.
The primary trend is up. A fall below $390 would signal reversal.
Incredible Charts - now with US
Data
|
FREE trial - Click Here
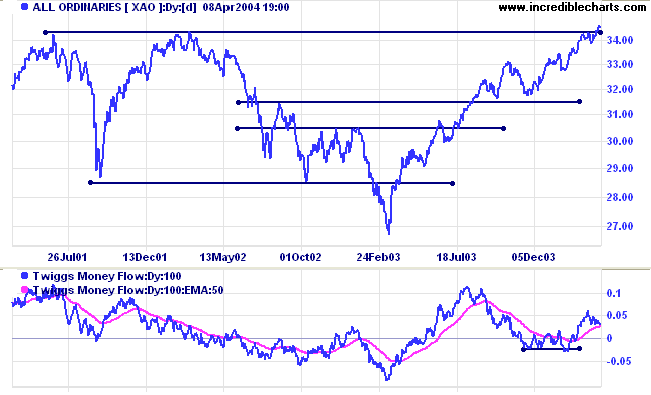
ASX Australia
The All Ordinaries did not expand as rapidly as
expected, after last week's compressed spring; possibly
due to the Easter weekend. With a breakout above resistance, at
3425 to 3450, the index is making record new highs. Conservative
traders may wait for a consolidation or pull-back that respects
the new support level.
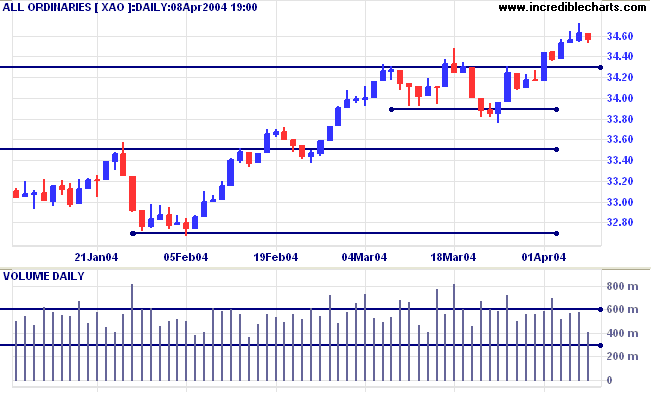
The intermediate and primary trends are
up.
Twiggs Money Flow signals accumulation (intermediate), with the indicator above its signal line. The long-term picture appears more doubtful, with the indicator well below its August 2003 high.
Twiggs Money Flow signals accumulation (intermediate), with the indicator above its signal line. The long-term picture appears more doubtful, with the indicator well below its August 2003 high.
Incredible Charts Premium
version
|
FREE trial - Click Here
Stock Screening -
Gaps
Gaps occur when the lowest price traded is above the high of the previous day or, conversely, when the highest price traded is below the previous day’s low.
There are four main types of gaps:
Screening for gaps is relatively easy:
Gaps occur when the lowest price traded is above the high of the previous day or, conversely, when the highest price traded is below the previous day’s low.
There are four main types of gaps:
- Common gaps
- Breakaway
- Continuation
- Exhaustion
Screening for gaps is relatively easy:
-
Open the Stock Screen module from the
toolbar

- Select Gaps
-
Then select
- Price Gapped Up when looking for long entries
- Price Gapped Down for short entries.
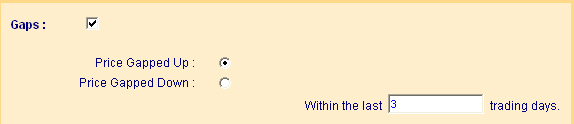
- Finally, add a time frame (e.g. 3 days) and Submit.
This will return stocks all stocks that have
gapped up in the past 3 days. Fairly useful, but you will have to
wade through a large number of common gaps before you find
a few decent breakaways.
To identify particular types of gaps, combine with Directional Movement (or Moving Average) filters :
To identify particular types of gaps, combine with Directional Movement (or Moving Average) filters :
- Select Directional Movement System
-
And DI+,DI-(14)
Crossovers:
- Bull signal
- Within the last 9999 days (to capture all stocks where DI+ is greater than DI-)
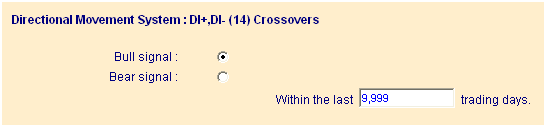
-
Then select ADX
Crossovers:
- Crossover of 20
- Crosses Above
- Within the last 20 days (to capture stocks that recently started trending)
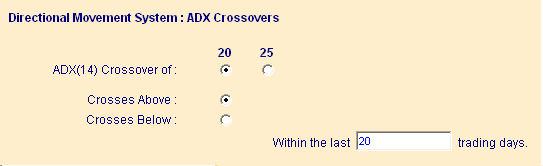
This will return potential breakaway and
continuation gaps.
Sort on the ADX Crossovers field (by clicking on the column header) to find the most recent breakaways.
Sort on the ADX Crossovers field (by clicking on the column header) to find the most recent breakaways.
Chart Forum: Profile images
You are now able to add an image to your
Chart Forum profile. The image will be displayed with your posts
(provided it is in good taste).To add an image:
- Login to your Chart Forum Profile
- Select Picture
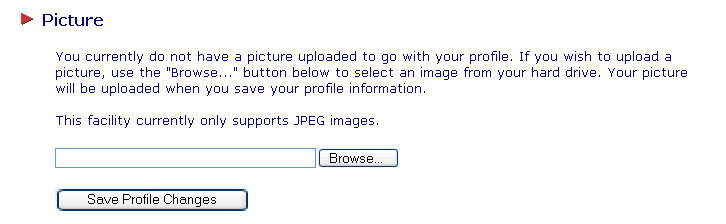
- Click the Browse button and select a JPEG image from your files
- Save Profile Changes.
About
the Trading Diary has been expanded to offer further
assistance to readers, including directions on how to search the
archives.
Colin Twiggs
Opportunity is missed by most
because it is dressed in overalls
and looks like work.
~ Thomas Alva Edison.
because it is dressed in overalls
and looks like work.
~ Thomas Alva Edison.
Back Issues
Click here to access the Trading Diary Archives.
Click here to access the Trading Diary Archives.
Back Issues
Access the Trading Diary Archives.