Free Data
Except for the 30-day free trial, free end-of-day data will be
delayed by 18 hours from next week.
This means that the updates will occur at 10.00 a.m. - suitable
for training purposes but not active trading.
Premium subscribers are unaffected by these changes.
To find out more about premium subscriptions - see Incredible Offer.
Also, early US subscribers enjoy an extended free trial until
June 30 and will not be affected by the changes.
If your free trial expiry date is not correctly reflected (see
Help >> About), please contact members
support.
Trading Diary
April 3, 2004
These extracts from my daily trading diary
are for educational purposes
and should not be interpreted as investment
advice. Full terms and conditions can be found at Terms
of Use.
USA
After 3 days consolidation below resistance at 10400 the Dow
Industrial Average has broken through, to close at 10470.
Increased volume signals commitment from buyers. Expect a test of
resistance at 10750.
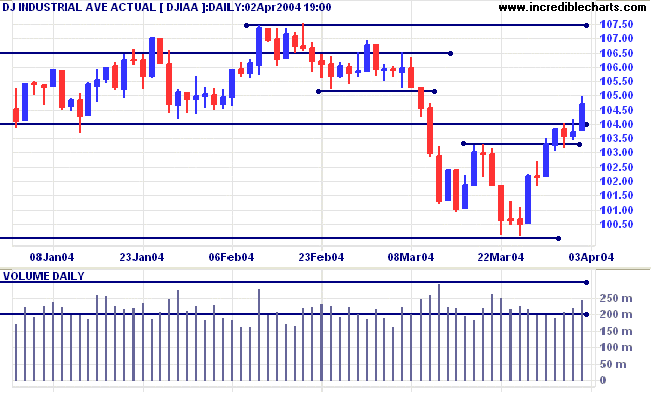
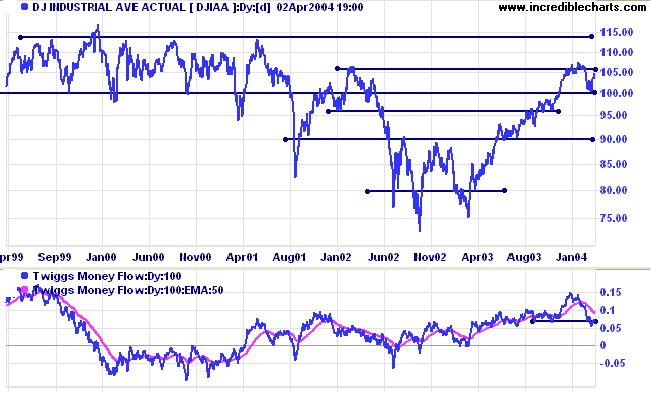
Penetration of resistance at 10750 would signal resumption of the
primary up-trend and is likely to result in a test of the 11400
level. Initial support is at 10400, followed by major support at
10000.
Twiggs Money Flow has rallied off the recent low but is still bearish..
Twiggs Money Flow has rallied off the recent low but is still bearish..
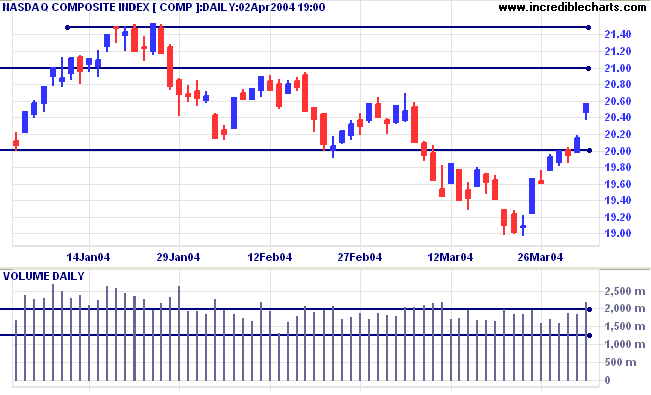
The Nasdaq Composite penetrated resistance at 2000,
followed by a gap up on strong volume; a bullish
sign.
The intermediate trend is up. The gap may exhaust short-term momentum but should herald a re-test of resistance at 2100. A rise above resistance at 2150 would signal resumption of the primary up-trend. Support is at 2000 and 1900 (major). Twiggs Money Flow is still bearish.
The intermediate trend is up. The gap may exhaust short-term momentum but should herald a re-test of resistance at 2100. A rise above resistance at 2150 would signal resumption of the primary up-trend. Support is at 2000 and 1900 (major). Twiggs Money Flow is still bearish.
The S&P 500 broke through resistance at 1125 on strong
volume. If the pull-back respects the new support level, we
should see a re-test of resistance at 1160.
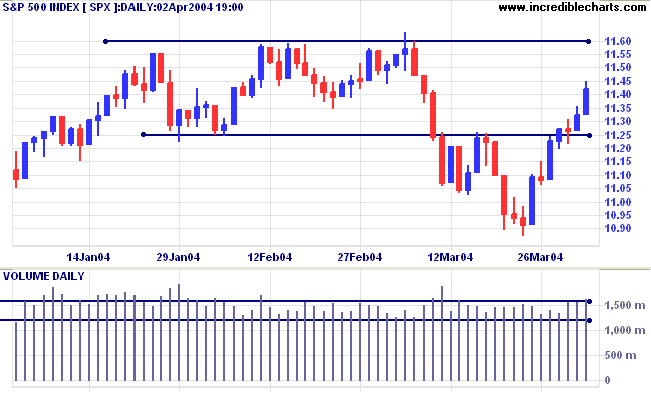
A rise above 1160 would signal resumption of the primary
up-trend. However, Twiggs Money Flow is still bearish.
Daylight Saving
New York: Daylight saving commences at 2:00 a.m. on April 4.
Times will shift to EDT (GMT-4) from EST (GMT-5).
For further details, see Coping with different Time Zones.
New York: Daylight saving commences at 2:00 a.m. on April 4.
Times will shift to EDT (GMT-4) from EST (GMT-5).
For further details, see Coping with different Time Zones.
Treasury yields
The yield on 10-year treasury notes rallied sharply to close at 4.14%.
The intermediate trend is uncertain. A rise above 4.25 would signal commencement of an up-trend.
The primary trend is down.
The yield on 10-year treasury notes rallied sharply to close at 4.14%.
The intermediate trend is uncertain. A rise above 4.25 would signal commencement of an up-trend.
The primary trend is down.
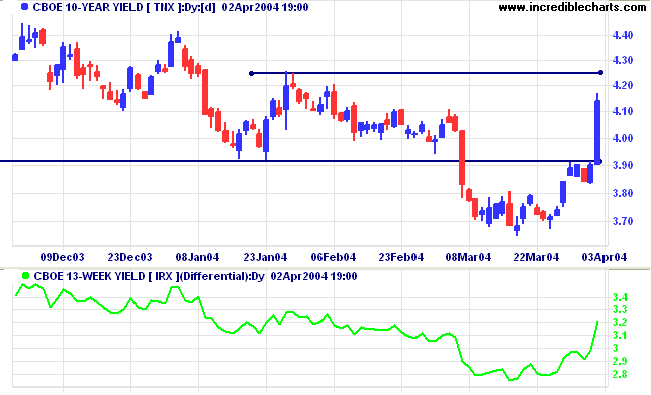
The
yield differential (10-year T-notes minus 13-week T-bills)
rose to a healthy 3.2%.
Gold
New York: Spot gold eased to $421.40 after testing resistance at $427.
The intermediate trend is up.
The primary trend is up. A fall below $390 would signal reversal.
New York: Spot gold eased to $421.40 after testing resistance at $427.
The intermediate trend is up.
The primary trend is up. A fall below $390 would signal reversal.
Incredible Charts - now with US
Data
|
FREE trial - Click Here
ASX Australia
The All Ordinaries formed a compressed
spring (a narrow range with strong volume) demonstrating
strong buying support. The compressed spring is normally followed
by a strong trend movement, in either direction, so entries are
often taken with a buy-stop above the High, or a sell-stop below
the Low.
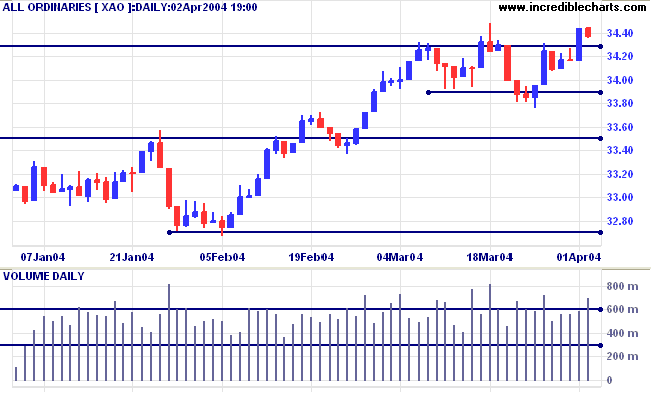
There may still be further resistance overhead
at 3450, while support is at 3160.
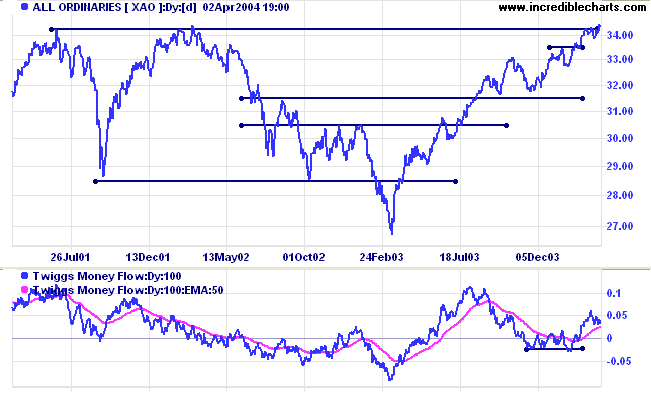
The intermediate and primary trends are up.
Twiggs Money Flow signals accumulation (intermediate time frame).
The intermediate and primary trends are up.
Twiggs Money Flow signals accumulation (intermediate time frame).
Incredible Charts Premium
version
|
FREE trial - Click Here
Stock Screening -
Directional Movement: Trend Starts
Welles Wilder's Directional Movement system consists of three lines:
Short signals, when -DI crosses to above +DI while ADX (also) turns up.
There are many different ways of trading with Directional Movement. See the Trading Guide for Alexander Elder's approach.
To identify potential long trades:
Welles Wilder's Directional Movement system consists of three lines:
- Positive Direction Indicator (+DI) indicates upward trend movement;
- Negative Direction Indicator (-DI) summarizes downward trend movement;
- ADX indicates the overall level of directional movement. High readings signal strong trends, while low readings indicate ranging stocks.
Short signals, when -DI crosses to above +DI while ADX (also) turns up.
There are many different ways of trading with Directional Movement. See the Trading Guide for Alexander Elder's approach.
To identify potential long trades:
-
Open the Stock Screen module from the
toolbar

- Select Directional Movement System
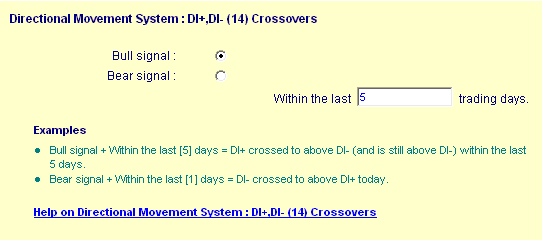
-
Under DI+, DI- (14)
Crossovers:
- select Bull Signal and
- within the last 5 trading days
-
Scroll down to ADX
Crossovers:
- select ADX (14) Crossover of 20
- Crosses Above and
- within the last 5 trading days
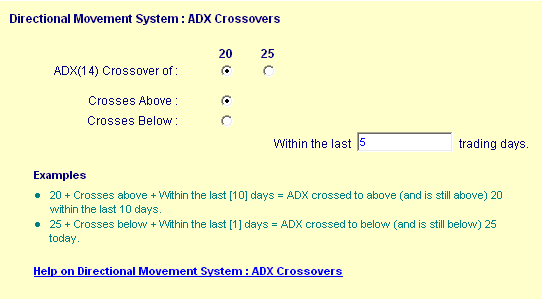
- Submit
This will return stocks where DI+ has crossed to
above DI- and ADX has crossed above 20.
As an alternative to the second filter you can use the ADX Reversals filter:
This may identify earlier turning points but
will give more incorrect signals.As an alternative to the second filter you can use the ADX Reversals filter:
- ADX (14) Reversal by 4 Points
- ADX turns up
- Within the last 5 trading days
Chart Forum: Email images
We have amended the Chart Forum code so that
images, for example charts, are displayed in email
notifications.To receive images in Chart Forum notices:
- Login to your Chart Forum Profile
- Select Email Notifications
- Scroll to Additional Email Notification Settings
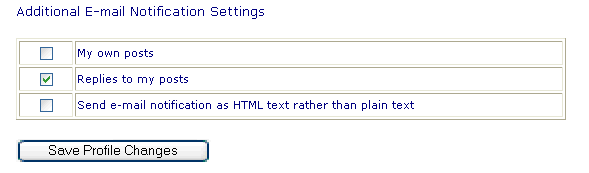
- Select Send e-mail notification as HTML text rather than plain text
- Save Profile Changes.
About
the Trading Diary has been expanded to offer further
assistance to readers, including directions on how to search the
archives.
Colin Twiggs
It will be the business of reason to rule with
wisdom and forethought on behalf of the entire soul;
while the spirited element ought to act as its subordinate and ally.
The two will be brought into accord, by that combination of mental and bodily training
which will tune up one string of the instrument and relax the other,
nourishing the reasoning part on the study of noble literature
and allaying the other's wildness by harmony and rhythm.
~ Plato.
Back Issues
Click here to access the Trading Diary Archives.
Click here to access the Trading Diary Archives.
Back Issues
Access the Trading Diary Archives.