Daily Trading Diary - Subscriptions
|
We have removed the Daily Trading Diary from the
subscription page until the new format is
resolved.
New subscribers will be afforded the opportunity to
subscribe at the old price when the Diary is
re-introduced.
|
Trading Diary
February 23, 2004
These extracts from my daily trading diary are
for educational purposes and should not be interpreted as
investment advice. Full terms and conditions can be found at
Terms
of Use .
ASX Australia
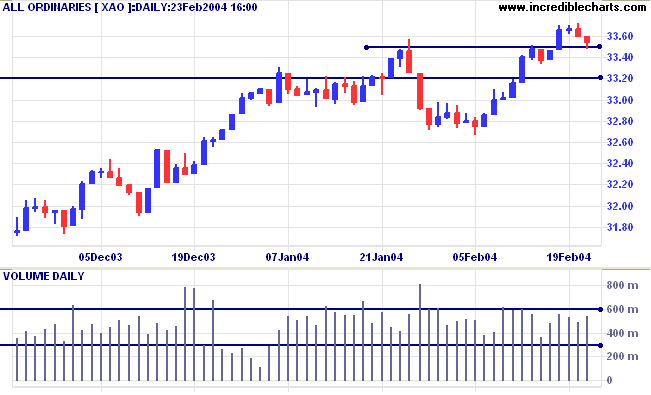
The All Ordinaries tested support at 3350 before
closing at 3354. A fairly weak close and higher volume indicate
buying support. For the fast up-trend to continue, the index
must respect the 3350 support level. A (sustained) rise above
today's high will be a bull signal. A fall below last Monday's
low of 3333 would be bearish.
The intermediate trend is up. A fall below
support at 3320 would be bearish.
The primary trend is up. Resistance is at the 2001/2002 highs of
3425 and 3440. Support is at 3160.
Stock Screening - Stage 1 Breakouts
I have received
several requests for an explanation of how to screen for Stage 1
breakouts.
Just to ensure that everyone knows what a Stage 1 breakout is,
here is an excerpt from
About
the Trading Diary:
|
Market Stages
There are four possible stages/phases:
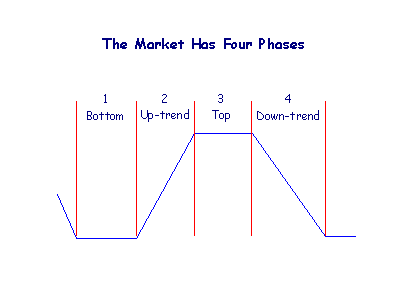
-
Base or bottom
The market
ranges between support and resistance, after a
stage 4 down-trend. The index normally
whipsaws around long-term moving averages and there
may be clear signs of accumulation, including declining
volume on downward movements and increasing volume on
rallies.
-
Primary up-trend
Stage 2 up-trends will follow a breakout from stage 1.
The index
respects long-term moving averages (from above) and
there should be strong volume on rallies and light
volume on corrections.
-
Top
The market levels off into a
trading range after a stage 2 up-trend. The index
normally
whipsaws around long-term moving averages. A stage
3 top normally continues to show high volume as the
market repeatedly attempts to overcome resistance. A
dry-up of volume may signal that the trading range will
breakout on the upside, reverting back to a stage 2
up-trend.
-
Primary down-trend
A stage 4 down-trend will follow a break below a stage
3 top. The index
respects long-term moving averages (from below) and
there should be strong volume on declines and light
volume on upward corrections.
Sometimes the market will form a chart pattern, such as a
descending or ascending triangle, in place of a
rectangular trading range at a top or bottom. And fairly
often the market forms a mid-point consolidation, easily
mistaken for a Stage 3 Top, at roughly half-way through
Stage 2.
|
A Stage 1 bottom is likely to have the following
characteristics:
-
price has moved sideways for an extended
time period;
-
moving averages whipsaw as price is
ranging;
-
volatility and volume decline;
-
Directional Movement is low;
-
Price will make a new 3-month or 6-month
high at the breakout.
If we want to trade pull-backs, where the stock
has broken out of its base and then pulls back to test the new
support level, we will have to follow the stock from its initial
breakout.
-
The most important screen will be the %
Of Price High: insert 100 as the 3-month or
6-month minimum.
Now this will identify all stocks making
new highs, not just those breaking out from a base; so how do we
narrow the search?
-
First we eliminate all dormant or illiquid
stocks by adding a Volume Filter:
20-day Volume MA; minimum value 1000 (or 10000 depending on
what stocks you wish to trade).
-
You could select an index such as the All
Ordinaries or ASX 300 instead of the Volume Filter.
-
Next, eliminate stocks already in strong
trending moves:
enter 20 as the Maximum % Move for 3, 6 and 12
months.
This screen will not be entirely accurate,
returning some stocks in mid-point consolidations and others that
have completed a secondary reaction. But at least you will only
need to scan 10 or so stocks, for signs of a breakout, rather
than the entire market.
An alternative is to screen for Directional Movement - I will
cover that tomorrow.
To screen for stocks that may be approaching a
stage 1 breakout (rather than stocks that have completed a
breakout), repeat the above screen but use 96 or 98
as the % Of Price High.
About
the Trading Diary has been expanded to offer further
assistance to readers, including directions on how to search the
archives.
Colin Twiggs
There are two classes of people who tell what
is going to happen in the future:
Those who don't know, and those who don't know they don't
know.
~ John Kenneth Galbraith.
Back
Issues
Access the Trading Diary Archives.