A Quick Survey
We are considering changing the Trading
Diary format. Please assist us by replying to this email
and completing the questions below. Highlight selected
answers in red
or with an asterisk*.
Your feedback will help us to identify areas that need attention.
Thanks |
Trading Diary
February 10, 2004
These extracts from my daily trading diary are
for educational purposes and should not be interpreted as
investment advice. Full terms and conditions can be found at
Terms
of Use .
USA
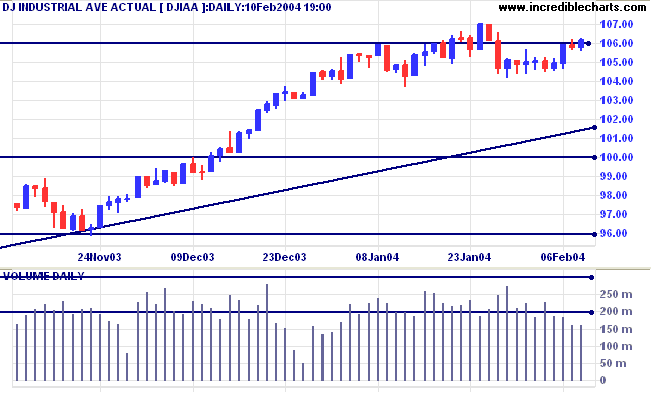
The Dow Industrial Average closed higher at
10613. Low volume over the last 3 days signals weakness.
The intermediate trend is uncertain. A fall below 10417 will indicate the start of a down-trend.
The primary trend is up. A fall below support at 9600 will signal reversal.
The intermediate trend is uncertain. A fall below 10417 will indicate the start of a down-trend.
The primary trend is up. A fall below support at 9600 will signal reversal.
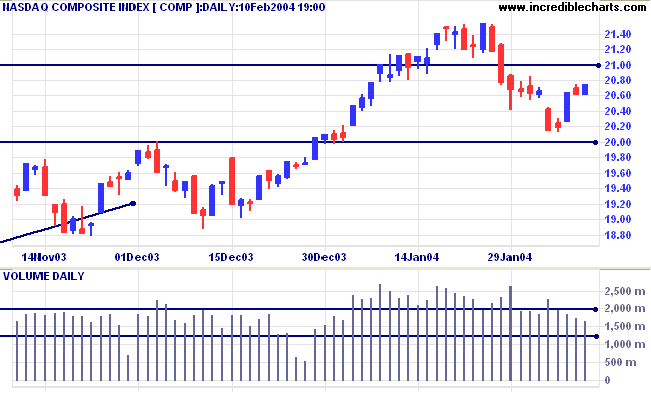
The Nasdaq Composite also shows lower volumes
on the latest retracement. The index closed up 15 points at
2075.
The intermediate trend is down. Support is at 2000.
The primary trend is up. A fall below support at 1640 will signal reversal.
The intermediate trend is down. Support is at 2000.
The primary trend is up. A fall below support at 1640 will signal reversal.
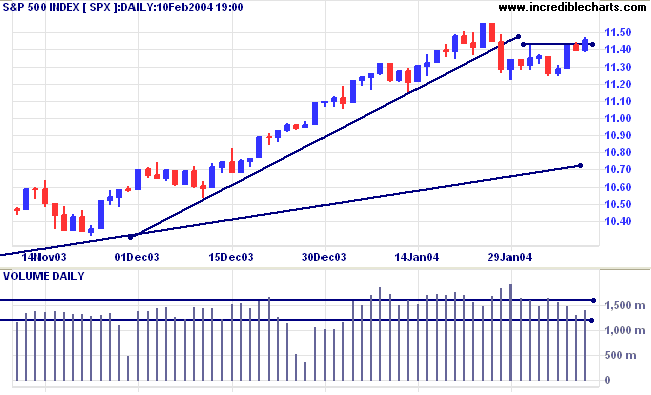
The S&P 500 appears healthier, closing up 6
points at 1145 on higher volume.
The intermediate trend is uncertain. Resistance is at 1155 and 1175 (from 2002). A fall below 1115 would signal the start of a down-trend.
Short-term: Bullish if the S&P500 is above 1155. Bearish below 1115.
The intermediate trend is uncertain. Resistance is at 1155 and 1175 (from 2002). A fall below 1115 would signal the start of a down-trend.
Short-term: Bullish if the S&P500 is above 1155. Bearish below 1115.
The primary trend is up. A fall below 960 will
signal reversal.
Intermediate: Bullish above 1155.
Long-term: Bullish above 1000.
Intermediate: Bullish above 1155.
Long-term: Bullish above 1000.
The Chartcraft NYSE Bullish % Indicator is almost
unchanged at 84.87%.
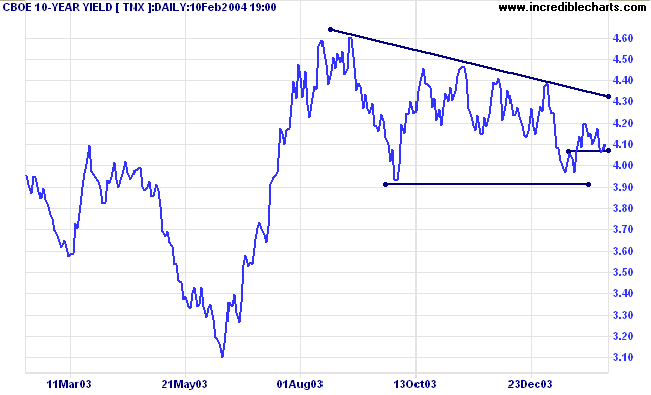
Treasury yields
The yield on 10-year treasury notes rallied to 4.10%.
The intermediate trend is down.
The primary trend is up. A close below 3.93%, the support level in a large descending triangle, will signal the start of a down-trend.
The yield on 10-year treasury notes rallied to 4.10%.
The intermediate trend is down.
The primary trend is up. A close below 3.93%, the support level in a large descending triangle, will signal the start of a down-trend.
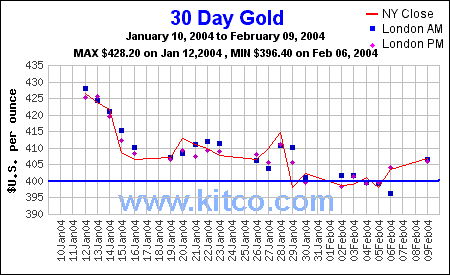
Gold
New York (21.28): Spot gold eased slightly to $406.70 after reaching 410 earlier in the day.
The intermediate trend is down.
The primary trend is up.
New York (21.28): Spot gold eased slightly to $406.70 after reaching 410 earlier in the day.
The intermediate trend is down.
The primary trend is up.
ASX Australia
The All Ordinaries closed almost unchanged at 3301. Like a
compressed spring, the narrow range with large volume signals
high latent energy: buyers and sellers were involved in an
intense tussle with neither able to gain control. The
intermediate trend is uncertain. A follow-through above Monday's
high of 3310 will be bullish. A fall below 3300 would be bearish.
Either way, we could see a strong move.
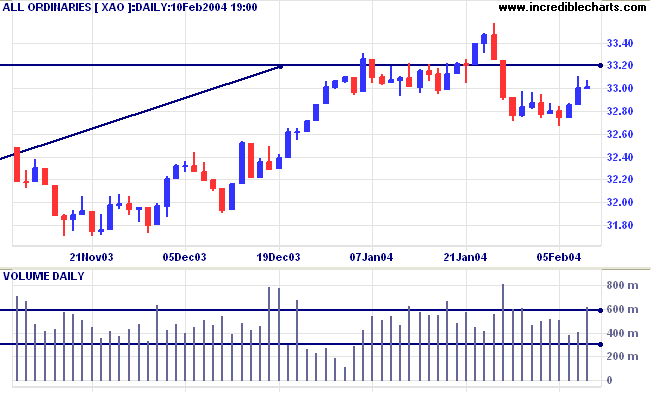
Twiggs Money Flow (100) is still below its 3-month support level,
signaling weakness.
The primary trend is up. A fall below 3160 (the October 1 low) would signal reversal.
Intermediate term: Bullish above 3350. Bearish below 3160.
Long-term: Bearish below 3160.
The primary trend is up. A fall below 3160 (the October 1 low) would signal reversal.
Intermediate term: Bullish above 3350. Bearish below 3160.
Long-term: Bearish below 3160.
Health Care: Facilities
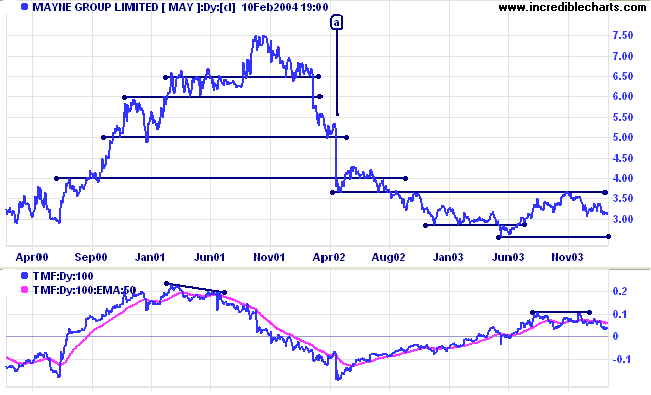
Mayne Group [MAY] was last covered on August 16, 2002.
MAY illustrates why you should not enter directly after a cathartic sell-off, assuming it to be an absolute bottom. Price gapped down sharply at [a] on large volume. After a short rally, MAY re-tested support at the low of [a] before falling to a new low and commencing a further down-trend. Twiggs Money Flow had given early warning of the October 2001 top, with a bearish divergence in June 2001. Again, at [a], the indicator started to rise well ahead of the eventual bottom. These signals may be premature, but alert us to fundamental changes in buyer and seller behavior.
MAY illustrates why you should not enter directly after a cathartic sell-off, assuming it to be an absolute bottom. Price gapped down sharply at [a] on large volume. After a short rally, MAY re-tested support at the low of [a] before falling to a new low and commencing a further down-trend. Twiggs Money Flow had given early warning of the October 2001 top, with a bearish divergence in June 2001. Again, at [a], the indicator started to rise well ahead of the eventual bottom. These signals may be premature, but alert us to fundamental changes in buyer and seller behavior.
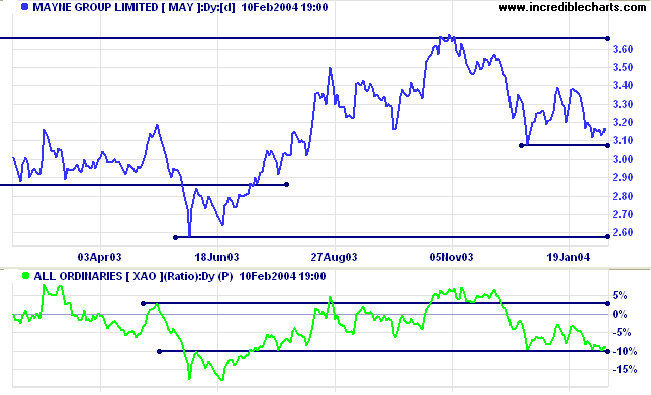
The latest bearish divergence on Twiggs Money Flow, in November
2003, foreshadowed weakness in both price and Relative Strength
(price ratio: xao). A fall below support at 3.05 would complete a
head and shoulders reversal with a target of 2.42: 3.05 - (3.68 -
3.05). This coincides roughly with support at 2.58.
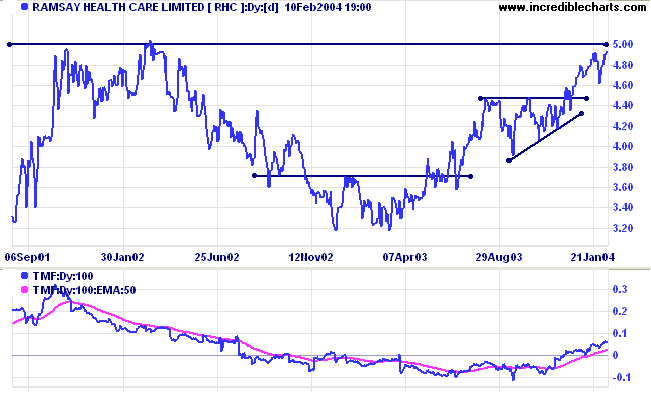
Ramsay Health Care [RHC] - last covered on August 6, 2003.
RHC is approaching major resistance at 5.00. Not a good time to enter unless there is a tight consolidation pattern, signaling accumulation, below the resistance level. Twiggs Money Flow started to rise after completion of an ascending triangle on the price chart. In this case the signal appears to be late.
RHC is approaching major resistance at 5.00. Not a good time to enter unless there is a tight consolidation pattern, signaling accumulation, below the resistance level. Twiggs Money Flow started to rise after completion of an ascending triangle on the price chart. In this case the signal appears to be late.
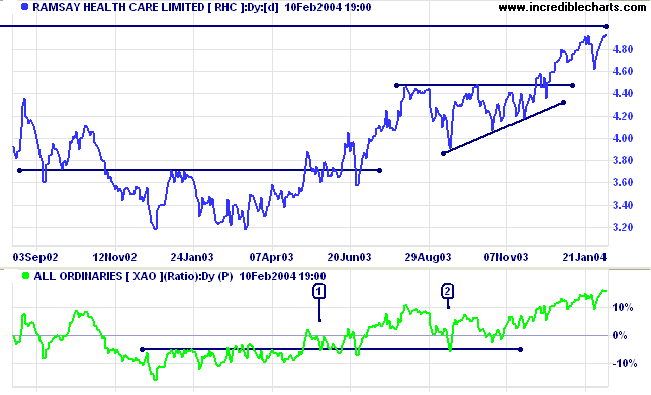
Relative Strength (price ratio: xao) gave earlier signs of a
breakout at [1] and, after a sharp pull-back at [2] has risen
strongly.
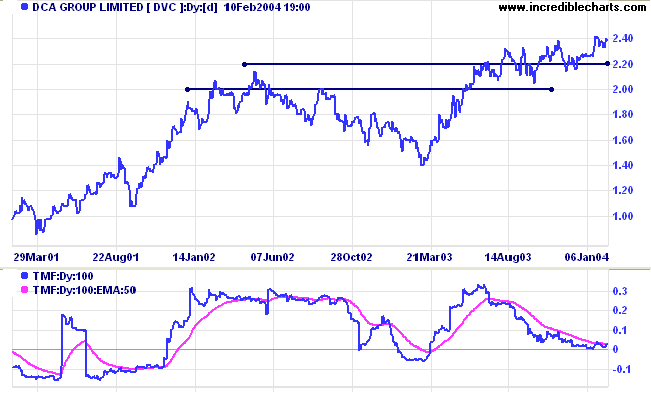
DCA Group [DVC]
DVC has broken to new highs above 2.20 but so far has been creeping upwards, rather than establishing a strong trend. As mentioned before, creeping trends can resolve into a fast up- or down-trend and need to be watched carefully. Twiggs Money Flow appears to be leveling out after a bearish divergence.
DVC has broken to new highs above 2.20 but so far has been creeping upwards, rather than establishing a strong trend. As mentioned before, creeping trends can resolve into a fast up- or down-trend and need to be watched carefully. Twiggs Money Flow appears to be leveling out after a bearish divergence.
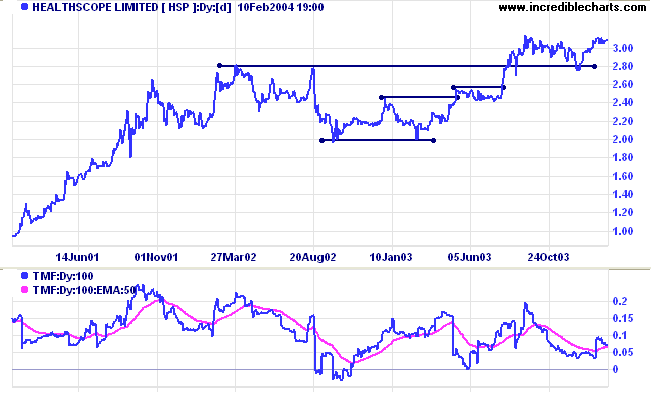
Healthscope [HSP] was last covered on April 30, 2002.
HSP displayed a lengthy mid-point consolidation between 2.80 and 2.00 before rallying to new highs. Similar to DVC above, price has not made much progress since the breakout. But consolidation above a new support level (in an up-trend) is a bullish sign. Twiggs Money Flow shows a few sharp sell-offs in the last two years but has managed to maintain above zero.
HSP displayed a lengthy mid-point consolidation between 2.80 and 2.00 before rallying to new highs. Similar to DVC above, price has not made much progress since the breakout. But consolidation above a new support level (in an up-trend) is a bullish sign. Twiggs Money Flow shows a few sharp sell-offs in the last two years but has managed to maintain above zero.
About
the Trading Diary has been expanded to offer further
assistance to readers, including directions on how to search the
archives.
Colin Twiggs
The happiest people seem to be those who have no particular cause
for being happy, except that they are so.
~ William Ralph Inge.
~ William Ralph Inge.
Windows 2000
| If you use Windows 2000, please check that you have at least Service Pack 4 or later. There are SSL connection problems with earlier versions. Further information (and the latest update) is available at Microsoft Support. |
Back Issues
You can now view back issues at the Daily Trading Diary Archives.
You can now view back issues at the Daily Trading Diary Archives.
Back Issues
Access the Trading Diary Archives.