New Subscription Page
|
The new subscription page has now been
posted at Subscribe. It offers the Premium Charting service and the Daily Trading Diary separately at $180 AUD each, or $270 for the combined service (as previously offered). Existing members who wish to amend their subscription to one of the new options should contact members support, with their ShopperID or Activation Key, before 27th February 2004. |
Trading Diary
February 5, 2004
These extracts from my daily trading diary are
for educational purposes and should not be interpreted as
investment advice. Full terms and conditions can be found at
Terms
of Use .
USA
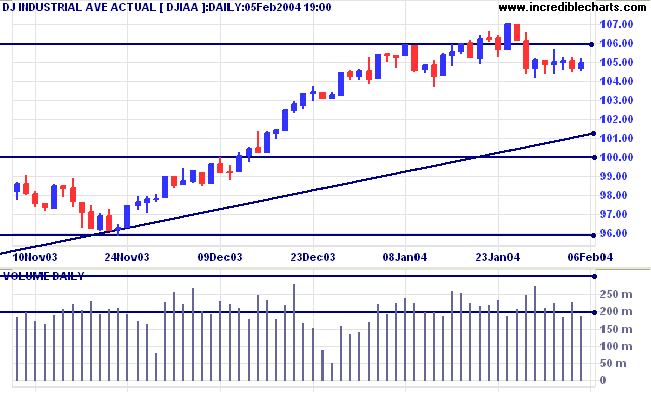
The Dow Industrial Average continues to
consolidate, forming an
inside day with a slightly higher close, at 10495, on low
volume.
The intermediate trend is uncertain. A fall below last Thursday's low of 10417 would signal reversal to a down-trend.
The primary trend is up. A fall below support at 9600 would indicate reversal.
The intermediate trend is uncertain. A fall below last Thursday's low of 10417 would signal reversal to a down-trend.
The primary trend is up. A fall below support at 9600 would indicate reversal.
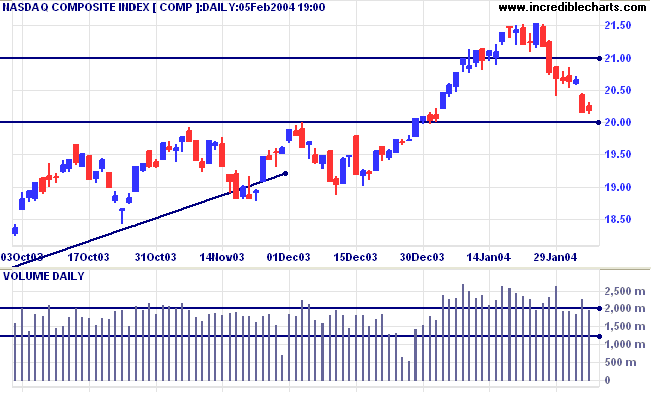
The Nasdaq Composite paused above support at
2000, after yesterday's sharp downward move. The
inside day closed up at 2019 on lower volume.
The intermediate trend is down.
The primary trend is up. A fall below support at 1640 would signal reversal.
The intermediate trend is down.
The primary trend is up. A fall below support at 1640 would signal reversal.
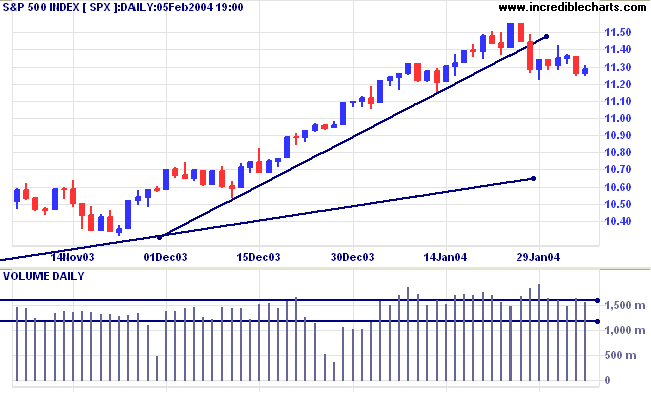
The S&P 500 continues to trade in a narrow
range, forming an
inside day with a higher close at 1128 on lower
volume.
The intermediate trend is uncertain. A fall below last Thursday's low of 1122 would signal reversal to a down-trend.
Short-term: Bullish if the S&P500 is above 1155. Bearish below 1122.
The intermediate trend is uncertain. A fall below last Thursday's low of 1122 would signal reversal to a down-trend.
Short-term: Bullish if the S&P500 is above 1155. Bearish below 1122.
The primary trend is up. A fall below 960 would
signal reversal.
Intermediate: Bullish above 1155.
Long-term: Bullish above 1000.
Intermediate: Bullish above 1155.
Long-term: Bullish above 1000.
The Chartcraft NYSE Bullish % Indicator increased
slightly to 84.11%.
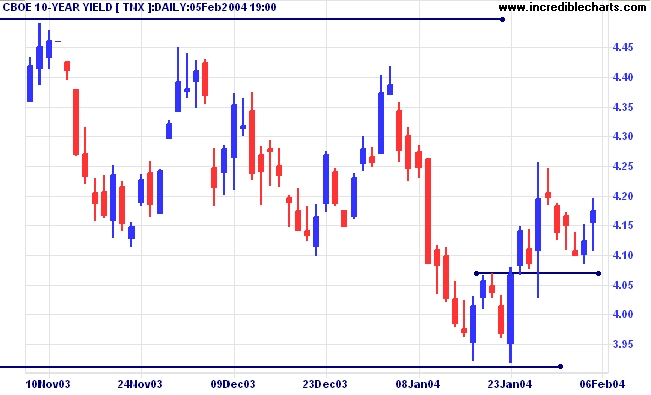
Treasury yields
The yield on 10-year treasury notes rallied to 4.174%.
The intermediate up-trend continues.
The primary trend is up. A close below 3.93% would signal reversal.
The yield on 10-year treasury notes rallied to 4.174%.
The intermediate up-trend continues.
The primary trend is up. A close below 3.93% would signal reversal.
Gold
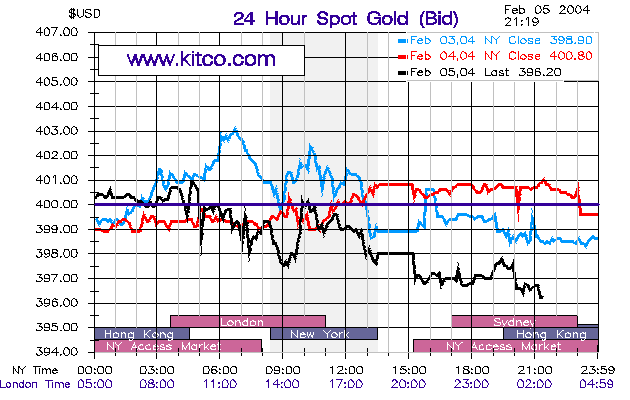
New York (21.19): Spot gold fell sharply to $396.20.
The intermediate trend is down.
The primary trend is up. A fall below $370 would signal reversal.
New York (21.19): Spot gold fell sharply to $396.20.
The intermediate trend is down.
The primary trend is up. A fall below $370 would signal reversal.
ASX Australia
The All Ordinaries made a false break below support at 3271
before closing back within the consolidation range, at 3275 on
average volume.
A fall below 3271 would signal an intermediate down-trend, with a likely test of support at 3160.
Short-term: Bullish above 3350. Bearish below 3271 (Thursday's low).
A fall below 3271 would signal an intermediate down-trend, with a likely test of support at 3160.
Short-term: Bullish above 3350. Bearish below 3271 (Thursday's low).
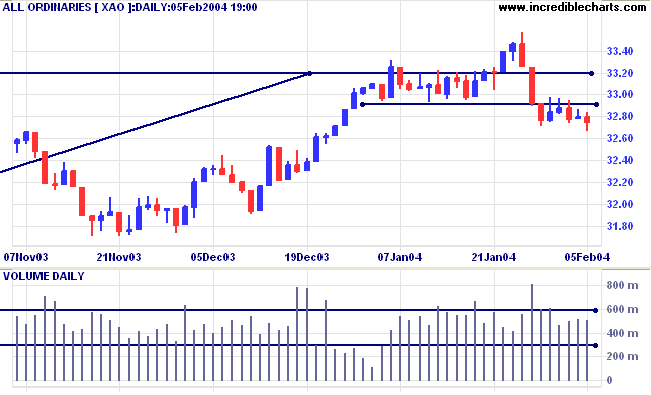
Twiggs Money Flow (100) has penetrated its 3-month support level;
a further bearish sign.
The primary trend is up. A fall below 3160 (the October 1 low) would signal reversal.
Intermediate term: Bullish above 3350. Bearish below 3160.
Long-term: Bearish below 3160.
The primary trend is up. A fall below 3160 (the October 1 low) would signal reversal.
Intermediate term: Bullish above 3350. Bearish below 3160.
Long-term: Bearish below 3160.
Biotechnology:
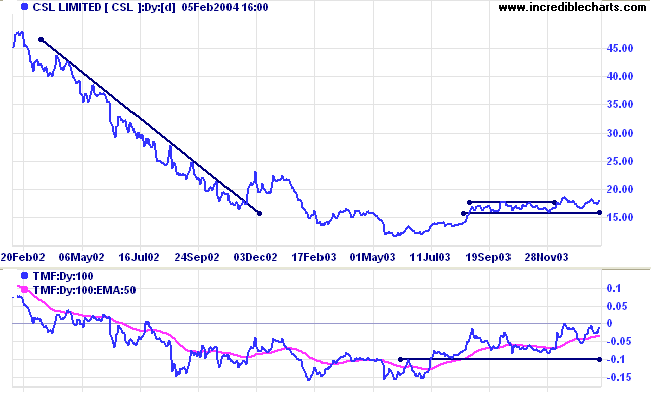
CSL Limited [CSL]
Last covered on December 8, 2003.
CSL formed a broad base over the last year, following a sharp stage 4 down-trend. Price is forming higher lows; a bullish sign.
Twiggs Money Flow displays a similar pattern, threatening to cross above zero.
Last covered on December 8, 2003.
CSL formed a broad base over the last year, following a sharp stage 4 down-trend. Price is forming higher lows; a bullish sign.
Twiggs Money Flow displays a similar pattern, threatening to cross above zero.
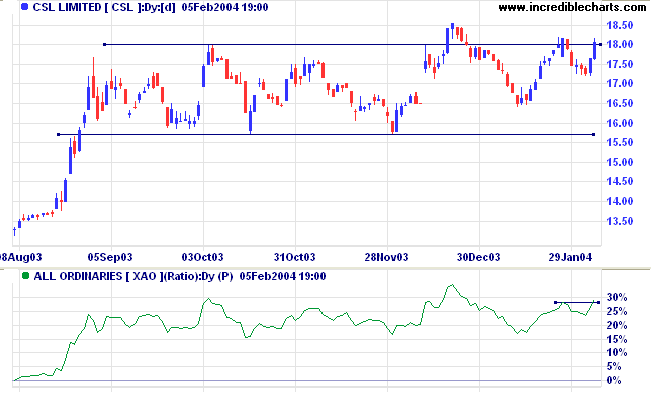
Relative Strength displays a similar bullish pattern.
It may be prudent to wait for a pull-back that respects the new support level at 18.00; especially as volume on the latest rally is fairly thin.
A close below support at 15.70, on the other hand, would be bearish.
It may be prudent to wait for a pull-back that respects the new support level at 18.00; especially as volume on the latest rally is fairly thin.
A close below support at 15.70, on the other hand, would be bearish.
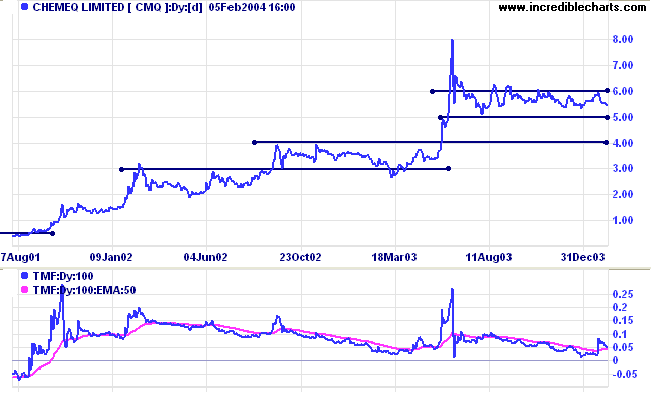
Chemeq [CMQ]
Last covered October 21, 2003.
Chemeq has consolidated between 5.00 and 6.00 since the blow-off spike in June 2003. Twiggs Money Flow has declined but is still impressive, not having fallen below zero since 2001. This stock may well have further upside and should be monitored closely.
A break above 6.00 would be bullish; below 5.00, bearish.
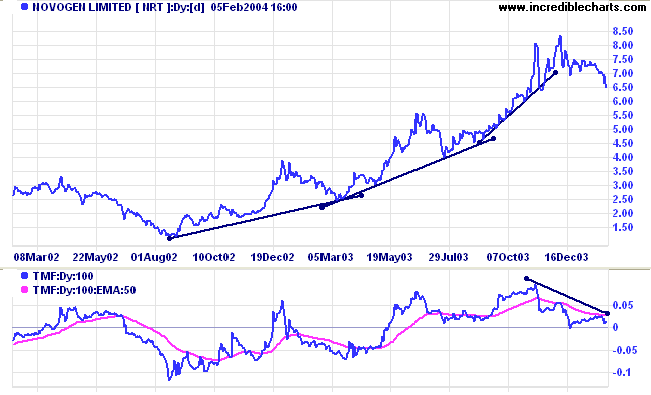
Novogen [NRT]
Last covered December 10, 2003. NRT has struggled to make further gains after the blow-off spike in November 2003 and is now threatening to reverse into a down-trend. Twiggs Money Flow displays a bearish divergence.
Last covered December 10, 2003. NRT has struggled to make further gains after the blow-off spike in November 2003 and is now threatening to reverse into a down-trend. Twiggs Money Flow displays a bearish divergence.
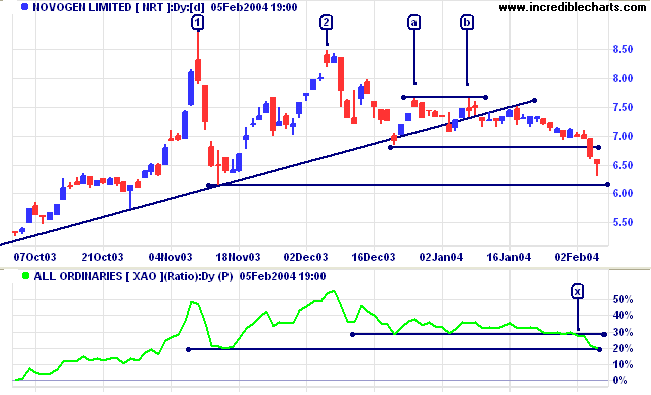
The blow-off spike at [1] was followed by a failed attempt to
make a new high, at [2]. Equal highs in a down-trend, at [a] and
[b], are a further bearish sign. Not quite a classic double
top, but a fall below support at 6.15 will be a strong bear
signal.
Relative Strength (price ratio: xao) has broken below the 1-month support level at [x] and is threatening the 3-month level. A peak that forms below resistance at 30% would add further confirmation of the bear signal.
Relative Strength (price ratio: xao) has broken below the 1-month support level at [x] and is threatening the 3-month level. A peak that forms below resistance at 30% would add further confirmation of the bear signal.
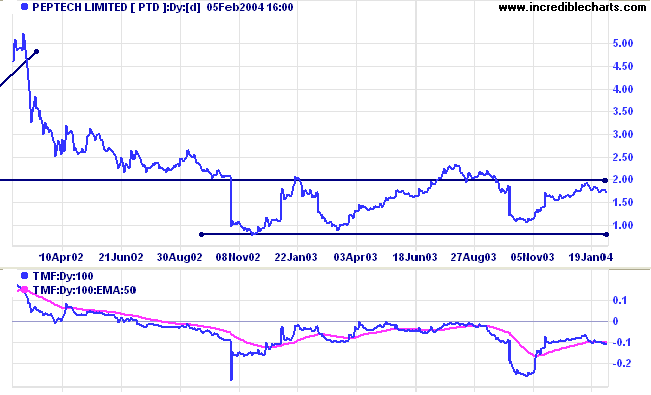
Peptech [PTD]
Last covered November 19, 2003.
Peptech encountered strong resistance at 2.00. Twiggs Money Flow signals distribution.
Support is at 1.00.
Last covered November 19, 2003.
Peptech encountered strong resistance at 2.00. Twiggs Money Flow signals distribution.
Support is at 1.00.
About
the Trading Diary has been expanded to offer further
assistance to readers, including directions on how to search the
archives.
Colin Twiggs
If you are not bright, you've got to be methodical.
~ Robert Sachs.
~ Robert Sachs.
Subscription Page: Single Diary
There are major obstacles to offering a
free trial of the Trading Diary.
Instead we have enabled readers to purchase a single
issue on the
Subscribe
page.
Back Issues
You can now view back issues at the Daily Trading Diary Archives.
You can now view back issues at the Daily Trading Diary Archives.
Back Issues
Access the Trading Diary Archives.