Live Update: Internet Explorer 6
| Some members have reported that earlier versions of Internet Explorer interfere with the Live Update. If you experience a timeout error during the Live Update, update to Internet Explorer 6 at Microsoft Download. |
Trading Diary
January 29, 2004
These extracts from my daily trading diary are for educational
purposes and should not be interpreted as investment advice. Full
terms and conditions can be found at Terms
of Use .
USA
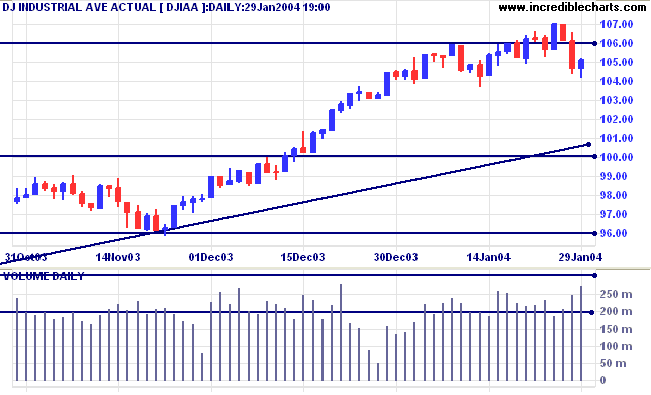
The Dow Industrial Average recovered to close
0.4% higher at 10510. Higher volume and a strong close signal
buying pressure.
The intermediate trend is still up. The strength of the next rally will determine whether the trend reverses.
The primary trend is up. A fall below support at 9600 would signal reversal.
The intermediate trend is still up. The strength of the next rally will determine whether the trend reverses.
The primary trend is up. A fall below support at 9600 would signal reversal.
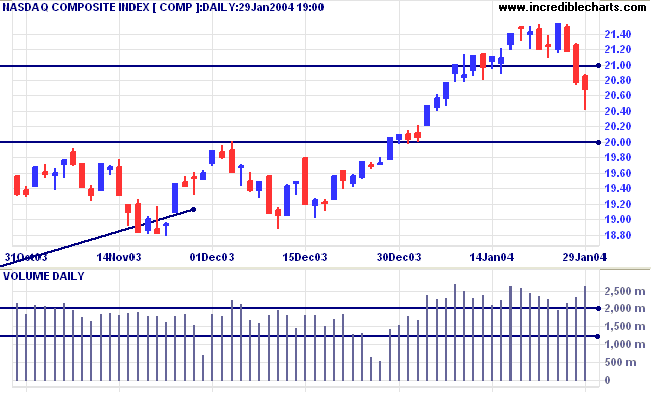
Strong volume and a weak close on the Nasdaq
Composite, at 2068, signal buying pressure. The strength of the
next rally will indicate whether the intermediate trend
reverses.
The primary trend is up. A fall below support at 1640 would signal reversal.
The primary trend is up. A fall below support at 1640 would signal reversal.
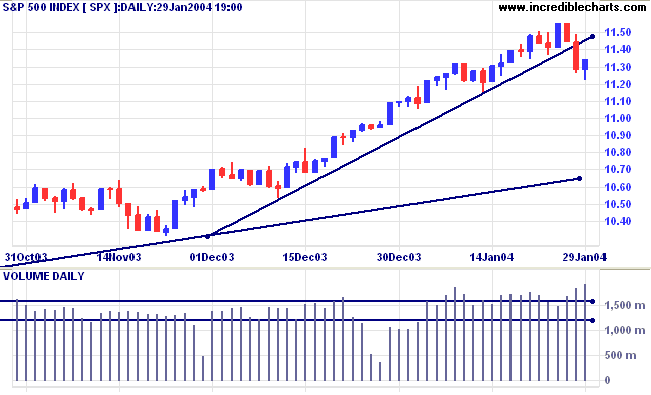
The S&P 500 displays a similar candle to
the Dow: large volume and a strong close signal buying support.
The index closed at 1134.
The intermediate trend is still up. The strength of the next rally will determine whether the trend reverses.
Short-term: Bullish if the S&P500 is above the high of 1155. Bearish below 1126 (Wednesday's low).
The intermediate trend is still up. The strength of the next rally will determine whether the trend reverses.
Short-term: Bullish if the S&P500 is above the high of 1155. Bearish below 1126 (Wednesday's low).
The primary trend is up. A fall below 960 would
signal reversal.
Intermediate: Bullish above 1155.
Long-term: Bullish above 1000.
Intermediate: Bullish above 1155.
Long-term: Bullish above 1000.
The Chartcraft NYSE Bullish % Indicator fell more
than 1% to 84.95%.
Jobless claims
New unemployment claims is almost unchanged at 342,000 for last week.(more)
New unemployment claims is almost unchanged at 342,000 for last week.(more)
Treasury yields
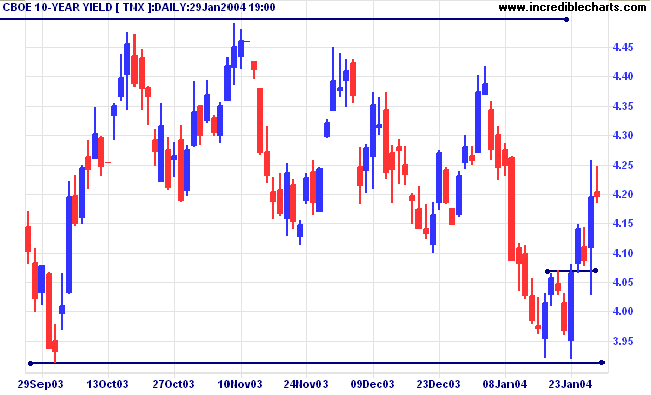
The yield on 10-year treasury notes closed almost unchanged at 4.197%.
The intermediate trend is up and appears headed for a re-test of resistance at 4.4% to 4.5%.
The primary trend is up. A close below 3.93% would signal reversal.
The yield on 10-year treasury notes closed almost unchanged at 4.197%.
The intermediate trend is up and appears headed for a re-test of resistance at 4.4% to 4.5%.
The primary trend is up. A close below 3.93% would signal reversal.
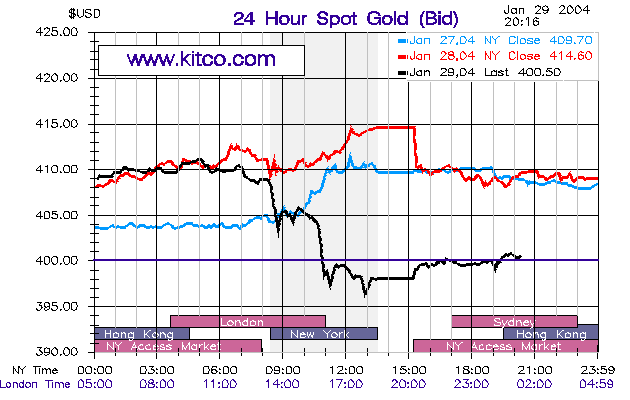
Gold
New York (16.43): Spot gold tested support, briefly falling below
400 before rallying to $400.50.
The intermediate trend is down.
The primary trend is up.
The intermediate trend is down.
The primary trend is up.
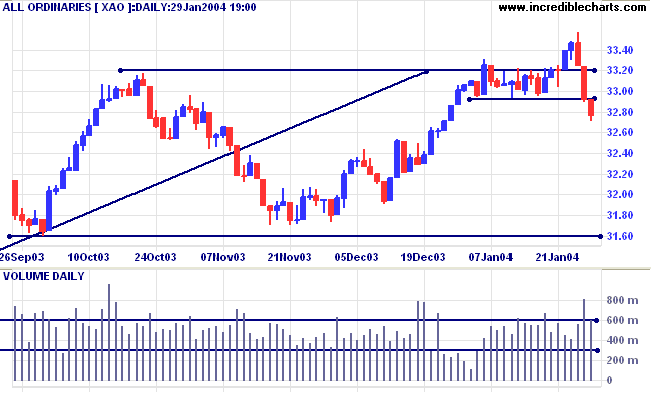
Australia
The All Ordinaries continues to fall, closing
down 21 points at 3271 on large volume. Strong downward (or
upward) bars with little or no overlap signal a fast down-trend;
it has taken 3 days to retrace to prices last seen a month ago.
This can dent buyers confidence. If they fail to rally stocks to
the previous high, then we will see a re-test of support at 3160.
A short retracement (one or 2 days) will be a strong bear signal.
A close below support at 3160 would signal a primary trend
reversal.
Twiggs Money Flow (100) is headed for a test of its 3-month support level.
Short-term: Bullish above 3350. Bearish below 3292.
Intermediate term: Bullish above 3350. Bearish below 3160.
Long-term: Bearish below 3160.
Twiggs Money Flow (100) is headed for a test of its 3-month support level.
Short-term: Bullish above 3350. Bearish below 3292.
Intermediate term: Bullish above 3350. Bearish below 3160.
Long-term: Bearish below 3160.
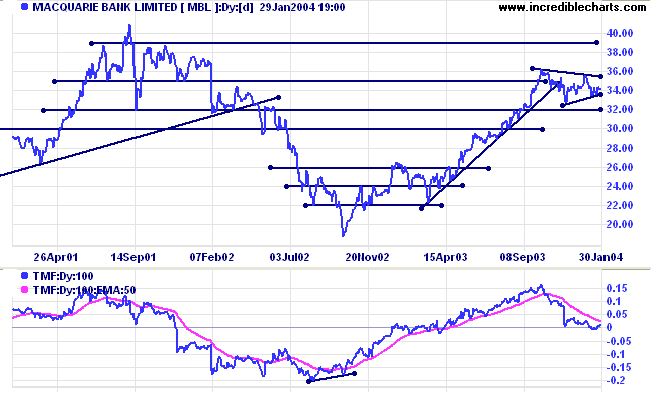
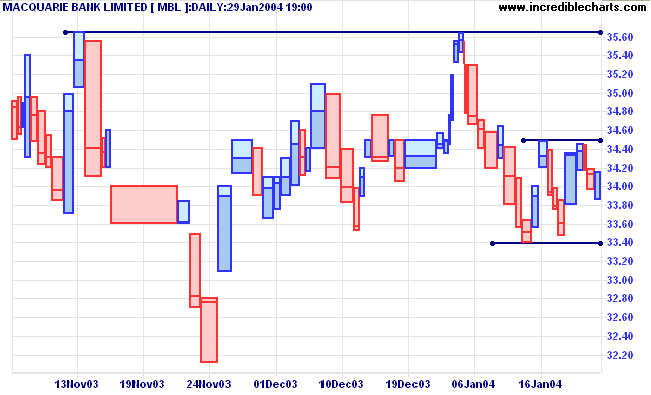
Macquarie Bank Limited [MBL]
Last covered on November 11, 2003.
Macquarie has formed a symmetrical triangle after a healthy stage 2 up-trend. Twiggs Money Flow (100) has reversed sharply to near the zero line, but this does not necessarily mean a reversal to a stage 4 down-trend. Symmetrical triangles often appear as mid-point consolidations, resolving into a further rally, roughly equal in magnitude to the first.
What we should not ignore, however, is the state of the overall market. The direction of the market index has a large influence on the performance of individual stocks, even top performers.
Relative Strength (price ratio: xao) has
retreated over recent months. A fall below recent (January) lows
would be a bear signal. A trough that finishes above the recent
high (-2%) would be a bull signal.
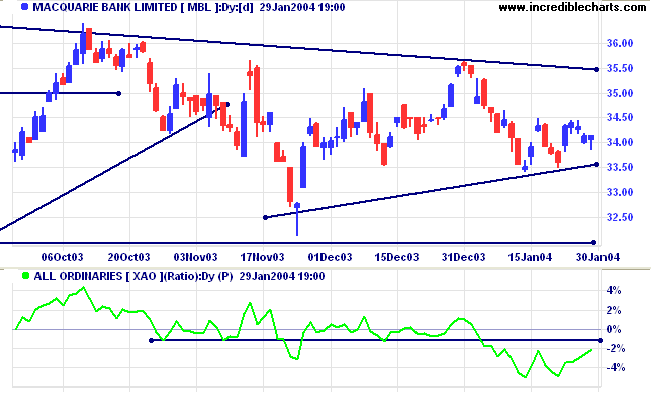
Volume is fairly evenly spaced between recent
up and down days on the Equivolume chart.
A fall below 33.40 would be a bear signal. A rise above 34.50 would be bullish.
It would be prudent, however, to wait for a pull-back that fails to cross above 33.40, or below 34.50, respectively.
A fall below 33.40 would be a bear signal. A rise above 34.50 would be bullish.
It would be prudent, however, to wait for a pull-back that fails to cross above 33.40, or below 34.50, respectively.
About
href="https://www.incrediblecharts.com/help/trading_diary_help.php">About
the Trading Diary has been expanded to offer further
assistance to readers, including directions on how to search the
archives.
Colin Twiggs
A healthy skepticism is seldom out of place in
Wall Street,
so far as speculation is concerned. Money is very seldom lost thereby.
People who have had experience covering one or two panics know very well
that the first lesson that has to be learned by the successful speculator
is the avoidance of the disaster always caused by a panic.
~ SA Nelson: The ABC of Stock Speculation.
Stock Screens: US Indexes
Dow Jones Industrial Average and the S&P 500
have been added to the list of Indexes
- for screening US stocks .
- for screening US stocks .
Back Issues
You can now view back issues at the Daily Trading Diary Archives.
You can now view back issues at the Daily Trading Diary Archives.
Back Issues
Access the Trading Diary Archives.