Incredible Charts version 4.0.2.800 is
now available.
Incredible Charts should automatically update when you connect to the server.
The new version offers adjusted end-of-day charts and stock screens
for ASX, NYSE, Nasdaq and Amex exchanges and US Indexes.
US sector allocations will be added later.
Incredible Charts should automatically update when you connect to the server.
The new version offers adjusted end-of-day charts and stock screens
for ASX, NYSE, Nasdaq and Amex exchanges and US Indexes.
US sector allocations will be added later.
Trading Diary
January 5, 2004
These extracts from my daily trading diary are
for educational purposes and should not be interpreted as
investment advice. Full terms and conditions can be found at
Terms
of Use .
USA
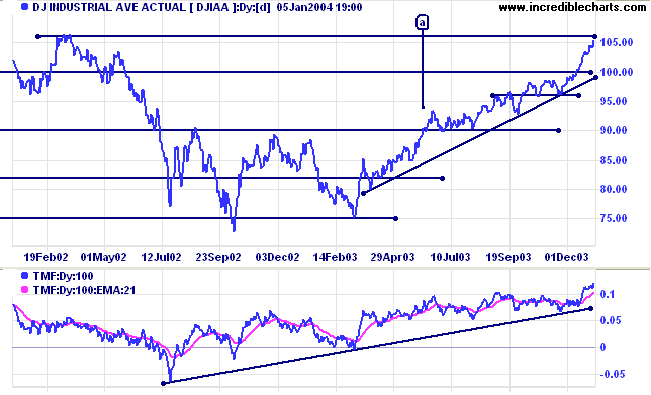
The fast up-trend on the Dow Industrial Average
is likely to encounter resistance at the 2002 high of 10600 and
either pull back to the long-term trendline or consolidate below
the resistance level (a bullish sign similar to the consolidation
after [a]). The index closed at 10544.
The intermediate trend is up.
The primary trend is up. A fall below support at 9600 will signal reversal.
The intermediate trend is up.
The primary trend is up. A fall below support at 9600 will signal reversal.
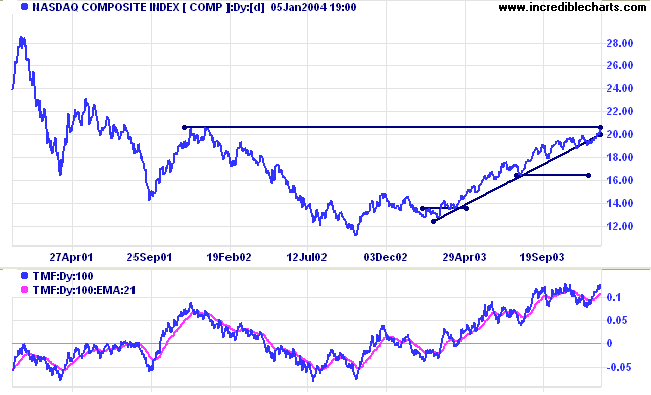
The Nasdaq Composite closed up strongly at 2047
and faces a similar resistance band at 2050 to 2077.
The intermediate trend is up.
The primary trend is up. A fall below support at 1640 will signal reversal.
The intermediate trend is up.
The primary trend is up. A fall below support at 1640 will signal reversal.
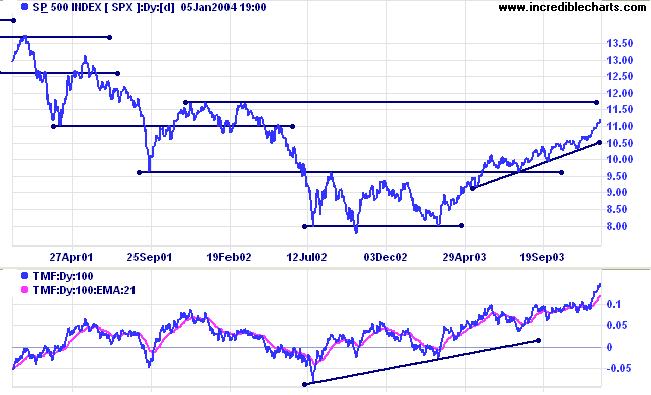
The S&P 500 faces a clearer path than the
above two indexes: the next resistance level is at 1175. The
index closed up at 1122.
The intermediate trend is up.
Short-term: Bullish if the S&P500 is above the high of 1109 (last Monday's high). Bearish below 1106 (Tuesday's low).
The intermediate trend is up.
Short-term: Bullish if the S&P500 is above the high of 1109 (last Monday's high). Bearish below 1106 (Tuesday's low).
The primary trend is up. A fall below 960 will
signal reversal.
Intermediate: Bullish above 1109.
Long-term: Bullish above 960.
Intermediate: Bullish above 1109.
Long-term: Bullish above 960.
The Chartcraft NYSE Bullish % Indicator increased
further to 85.06% (January 5).
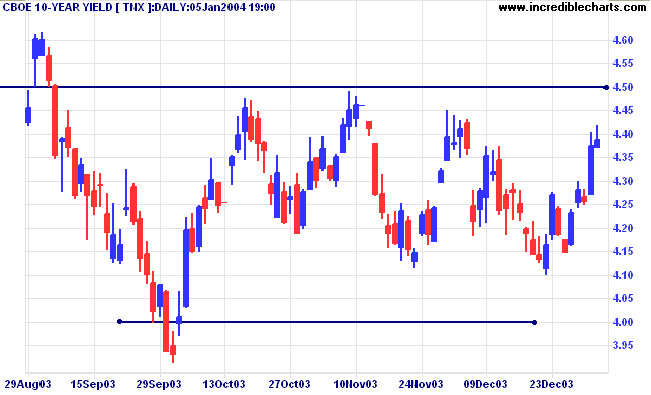
Treasury yields
The yield on 10-year treasury notes is up at 4.38%.
The intermediate trend is uncertain.
The primary trend is up.
The yield on 10-year treasury notes is up at 4.38%.
The intermediate trend is uncertain.
The primary trend is up.
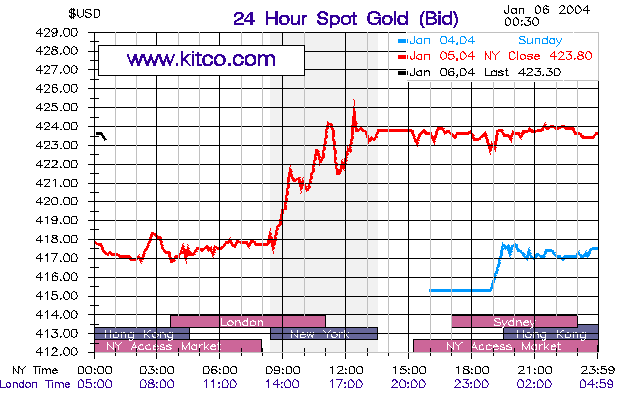
Gold
New York (00.30): Spot gold jumped to $423.30.
The intermediate trend is up.
The primary trend is up. Expect support at 415.
New York (00.30): Spot gold jumped to $423.30.
The intermediate trend is up.
The primary trend is up. Expect support at 415.
ASX Australia
The All Ordinaries encountered resistance, pulling back to 3296
on higher volume. If the index is able to penetrate resistance at
3317, we may see a strong surge in January, historically a
bullish month, as institutional buyers return from their
holidays. If the intermediate trend turns down,
we are likely to see a re-test of support at 3160.

MACD (26,12,9) is above its signal line; Slow Stochastic (20,3,3)
has crossed to below.
Short-term: Bullish above 3317.
Short-term: Bullish above 3317.
The All Ords is below its long-term trendline, signaling
weakness. The primary trend is up but will reverse if there is a
fall below 3160 (the October 1 low). Twiggs Money Flow (100) has
leveled out but is still bearish after a large divergence.
Intermediate term: Bullish above 3317. Bearish below 3160.
Long-term: Bearish below 3160.
Intermediate term: Bullish above 3317. Bearish below 3160.
Long-term: Bearish below 3160.
Understanding
the Trading Diary has been expanded to offer further
assistance to readers, including directions on how to search the
archives.
Colin Twiggs
| The object of a New Year is not that we should have a new year. It is that we should have a new soul and a new nose; new feet, a new backbone, new ears, and new eyes. Unless a particular man made New Year resolutions, he would make no resolutions. Unless a man starts afresh about things, he will certainly do nothing effective. Unless a man starts on the strange assumption that he has never existed before, it is quite certain that he will never exist afterwards. Unless a man be born again, he shall by no means enter into the Kingdom of Heaven. |
~ GK Chesterton: Daily News (circa
1907).

We wish you peace, health and prosperity in the year ahead.
Back Issues
You can now view back issues at the Daily Trading Diary Archives.
You can now view back issues at the Daily Trading Diary Archives.
Back Issues
Access the Trading Diary Archives.