
We hope that you had a wonderful Christmas
and wish you prosperity in the year ahead.
Trading Diary
December 26, 2003
These extracts from my daily trading diary are
for educational purposes and should not be interpreted as
investment advice. Full terms and conditions can be found at
Terms
of Use .
USA
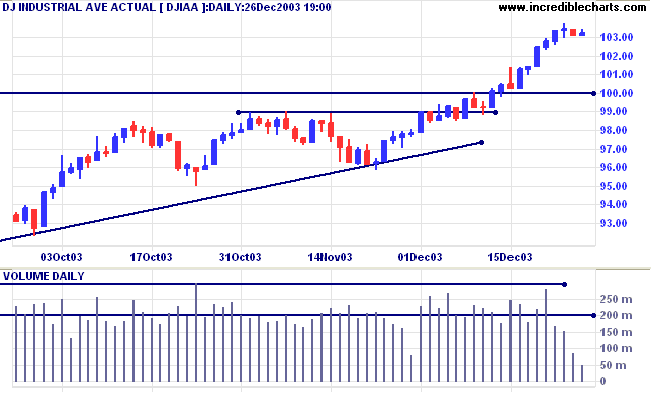
The Dow Industrial Average rally has lost momentum and we may see
a test of the new 10000 support level. The index closed at
10324.
The intermediate trend is up.
The primary trend is up. A fall below support at 9000 will signal reversal.
The intermediate trend is up.
The primary trend is up. A fall below support at 9000 will signal reversal.
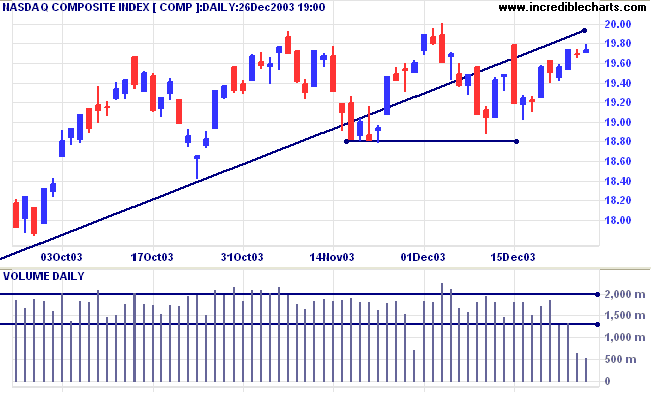
The Nasdaq Composite faces resistance at 2000, closing slightly
higher at 1973.
The intermediate trend is uncertain. A fall below 1880 will complete a double top reversal with a target of 1760: 1880-(2000-1880).
The primary trend is up. A fall below support at 1640 will signal reversal.
The intermediate trend is uncertain. A fall below 1880 will complete a double top reversal with a target of 1760: 1880-(2000-1880).
The primary trend is up. A fall below support at 1640 will signal reversal.
The S&P 500 also appears to have lost momentum, closing at
1095.
The intermediate trend is up.
Short-term: Bullish if the S&P500 is above Tuesday's high of 1097. Bearish below 1091 (Tuesday's low).
The intermediate trend is up.
Short-term: Bullish if the S&P500 is above Tuesday's high of 1097. Bearish below 1091 (Tuesday's low).
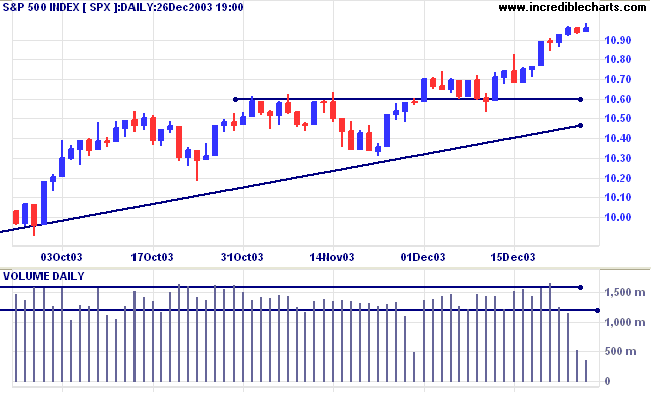
The primary trend is up. A fall below 960 will signal
reversal.
Intermediate: Bullish above 1097.
Long-term: Bullish above 960.
Intermediate: Bullish above 1097.
Long-term: Bullish above 960.
The Chartcraft NYSE Bullish % Indicator is at a
10-year high of 83.42% (December 26).
Durable goods orders fall
Manufacturing orders for durable goods fell sharply in November, across a wide range of products. (more)
Manufacturing orders for durable goods fell sharply in November, across a wide range of products. (more)
Wal-Mart sales low
Wal-mart says that it expects to only reach the low end of December sales forecasts. (more)
Wal-mart says that it expects to only reach the low end of December sales forecasts. (more)
US Stock Screens
We are making further changes to the new version
before releasing stock screens covering the US and Australian markets.
Adjusted end-of-day charts for NYSE, Nasdaq, Amex, US indexes
are accessible from the free version Securities menu until further notice in 2004.
We are making further changes to the new version
before releasing stock screens covering the US and Australian markets.
Adjusted end-of-day charts for NYSE, Nasdaq, Amex, US indexes
are accessible from the free version Securities menu until further notice in 2004.
Treasury yields
The yield on 10-year treasury notes has eased to 4.14%.
The intermediate trend is uncertain, with price consolidating between 4.0 and 4.5%.
The primary trend is up.
The yield on 10-year treasury notes has eased to 4.14%.
The intermediate trend is uncertain, with price consolidating between 4.0 and 4.5%.
The primary trend is up.
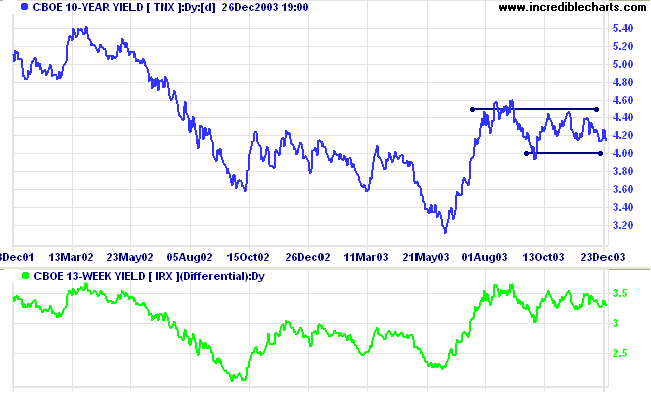
The
yield differential (10-year T-notes compared to 13-week
T-bills) is a healthy 3.3%.
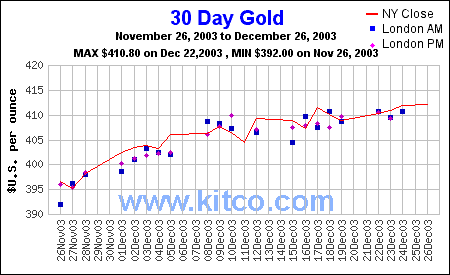
Gold
New York (13.30): Spot gold last traded at $411.90.
The intermediate trend is up.
The primary trend is up. Expect support at 400, resistance at 415 (the 10-year high).
New York (13.30): Spot gold last traded at $411.90.
The intermediate trend is up.
The primary trend is up. Expect support at 400, resistance at 415 (the 10-year high).
Subscribe to Incredible Charts Premium
version with:
|
ASX Australia
The All Ordinaries is in a creeping up-trend. Strong volume with
a narrow range signaled increased selling pressure on Tuesday.
But there was no follow-through on Wednesday with price closing
up at 3271 on low volume (to be expected with the market closing
at 2:05 p.m.). Expect resistance at 3300 to 3317.
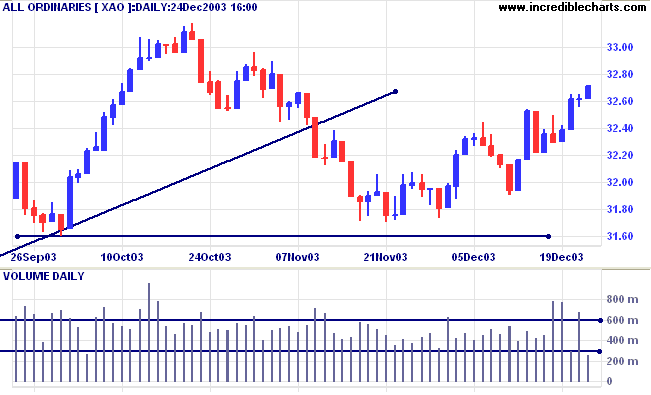
MACD (26,12,9) is above its signal line; Slow Stochastic (20,3,3)
is above.
Short-term: Bullish above 3261, Tuesday's high. Bearish below 3255, Tuesday's low.
Short-term: Bullish above 3261, Tuesday's high. Bearish below 3255, Tuesday's low.
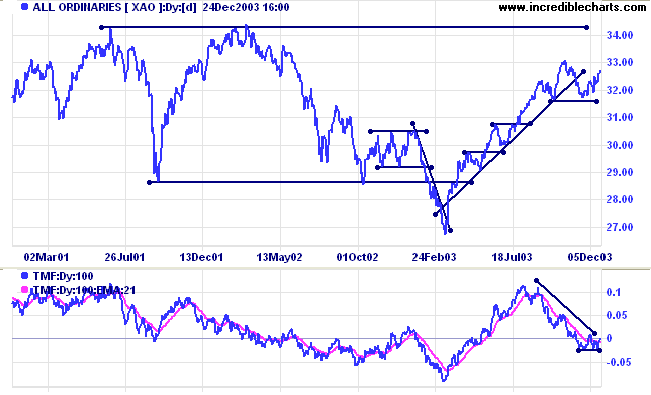
The All Ords is below its long-term trendline, signaling
weakness. The primary trend is up but will reverse if there is a
fall below 3160 (the October 1 low). Twiggs Money Flow (100) has
leveled out but is still bearish after a large divergence.
Intermediate term: Bullish above 3261. Bearish below 3160.
Long-term: Bearish below 3160.
Intermediate term: Bullish above 3261. Bearish below 3160.
Long-term: Bearish below 3160.
Sector Analysis
The 11 sectors (10 + Property) are in various market stages. Relative Strength (xjo) measures the performance of each sector relative to the overall index.
The 11 sectors (10 + Property) are in various market stages. Relative Strength (xjo) measures the performance of each sector relative to the overall index.
- Energy [XEJ] - stage 2 (RS is rising)
- Materials [XMJ] - stage 2 (RS is rising)
- Industrials [XNJ] - stage 2 (RS is rising)
- Consumer Discretionary [XDJ] - stage 2 (RS is falling)
- Consumer Staples [XSJ] - stage 1 (RS is level)
- Health Care [XHJ] - stage 1 (RS is falling)
- Property Trusts [XPJ] - stage 3 (RS is rising).
- Financial excl. Property [XXJ] - stage 4** (RS is level)
- Information Technology [XIJ] - stage 2 (RS is rising)
- Telecom Services [XTJ] - stage 2 (RS is falling)
- Utilities [XUJ] - stage 3 (RS is level)
** Financial-x-Property Trusts [XXJ] broke below the 3933
support level but has subsequently retreated back above.
This is a weak signal. Relative Strength (xjo), however, is
falling and I will treat the primary trend as downwards
until there is clear evidence to the contrary. A rise above 4136
will signal that the primary trend has turned upwards.
Sectors: Relative Strength
A stock screen of the ASX 200 using % Price Move (1 month: +5%) increased to 58 stocks (compared to 131 on April 11, 2003; and 8 on March 14, 2003). Prominent sectors are:
A stock screen of the ASX 200 using % Price Move (1 month: +5%) increased to 58 stocks (compared to 131 on April 11, 2003; and 8 on March 14, 2003). Prominent sectors are:
- Diversified Metals & Mining (6)
- Oil & Gas Exploration & Production (6)
- Diversified Commercial (4)
- Real Estate Investment Trusts (3)
- Broadcasting & Cable TV (3)
- Aluminum (2)
Understanding
the Trading Diary has been expanded to offer further
assistance to readers, including directions on how to search the
archives.
Colin Twiggs
If your axe is blunt and you don't sharpen it,
you have to work harder to use it.
It is more sensible to plan ahead.
- Ecclesiastes 10: 10
you have to work harder to use it.
It is more sensible to plan ahead.
- Ecclesiastes 10: 10
Daily Trading Diary
The Daily Trading Diary will resume on January 5th 2004,
after the Christmas break.
The Daily Trading Diary will resume on January 5th 2004,
after the Christmas break.
Back Issues
You can now view back issues at the Daily Trading Diary Archives.
You can now view back issues at the Daily Trading Diary Archives.
Back Issues
Access the Trading Diary Archives.