
Trading Diary
November 17, 2003
These extracts from my daily trading diary are
for educational purposes and should not be interpreted as
investment advice. Full terms and conditions can be found at
Terms
of Use .
USA
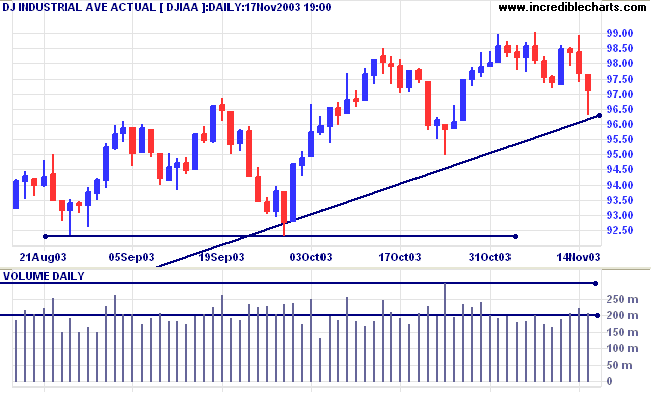
The Dow Industrial Average fell 0.6% to 9711 on low volume. The
long tail signals some buying support and a lack of commitment
from sellers.
The intermediate trend is down.
The primary trend is up. A fall below 9000 will signal reversal.
The intermediate trend is down.
The primary trend is up. A fall below 9000 will signal reversal.
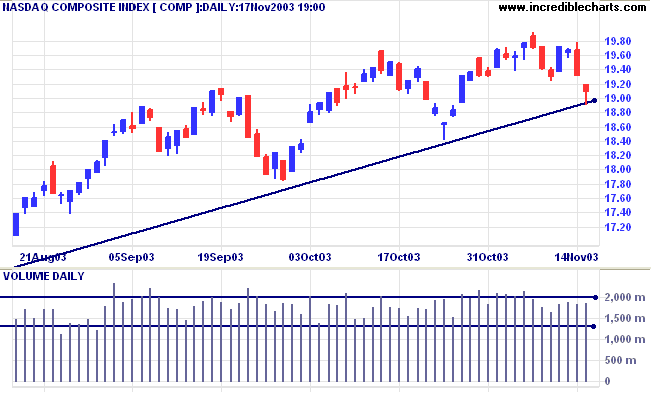
The Nasdaq Composite fell 20 points to close at 1910 on average
volume. The long tail signals buying support above the primary
trendline.
The intermediate trend has turned down. Expect resistance at 2000 and 2100, the January 2002 high.
The primary trend is up. A fall below 1640 will signal reversal.
The intermediate trend has turned down. Expect resistance at 2000 and 2100, the January 2002 high.
The primary trend is up. A fall below 1640 will signal reversal.
The S&P 500 fell 6 points to close at 1044 on average volume.
Again, the long tail signals buying support.
The intermediate trend is uncertain. Expect support at the primary trendline.
Short-term: Bullish if the S&P500 is above 1062. Bearish below 1043 (Tuesday's low).
The intermediate trend is uncertain. Expect support at the primary trendline.
Short-term: Bullish if the S&P500 is above 1062. Bearish below 1043 (Tuesday's low).
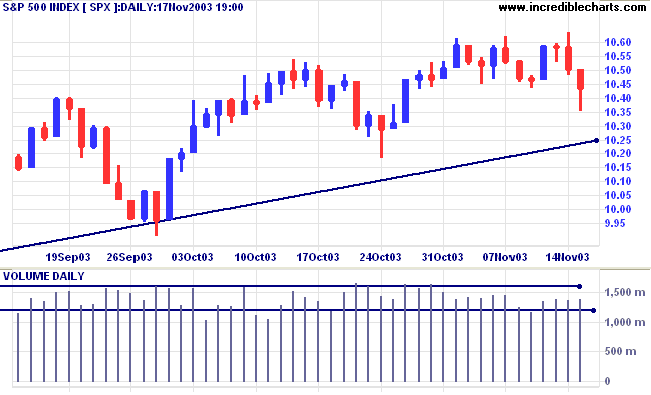
The primary trend is up. A fall below 960 will signal
reversal.
Twiggs Money Flow (100) continues to signal accumulation.
Intermediate: Bullish above 1062.
Long-term: Bullish above 960.
Twiggs Money Flow (100) continues to signal accumulation.
Intermediate: Bullish above 1062.
Long-term: Bullish above 960.
The Chartcraft NYSE Bullish % Indicator declined
to 80.61% (November 17).
Revision: according to Dorsey a fall below 70% (not a 3-box reversal) would signal a bear alert.
Revision: according to Dorsey a fall below 70% (not a 3-box reversal) would signal a bear alert.
Consumer confidence
Preliminary figures for November show the University of Michigan index up sharply at 93.5, compared to 89.6 in October. (more)
Preliminary figures for November show the University of Michigan index up sharply at 93.5, compared to 89.6 in October. (more)
Treasury yields
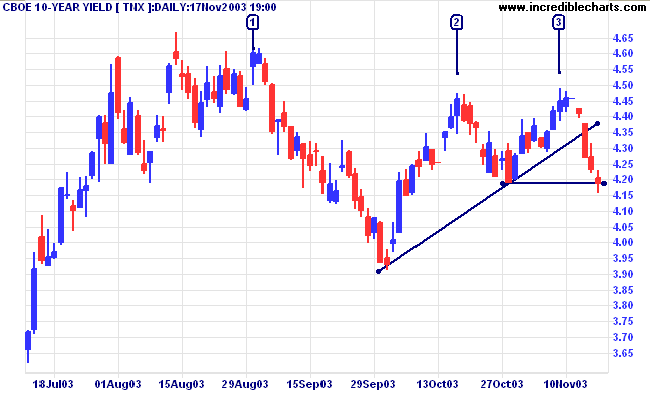
The yield on 10-year treasury notes fell to 4.19%.
The intermediate trend is up but equal highs, [2] and [3], below a higher peak [1] are a bear signal. A close below 4.19% will signal reversal.
The primary trend is up.
The yield on 10-year treasury notes fell to 4.19%.
The intermediate trend is up but equal highs, [2] and [3], below a higher peak [1] are a bear signal. A close below 4.19% will signal reversal.
The primary trend is up.
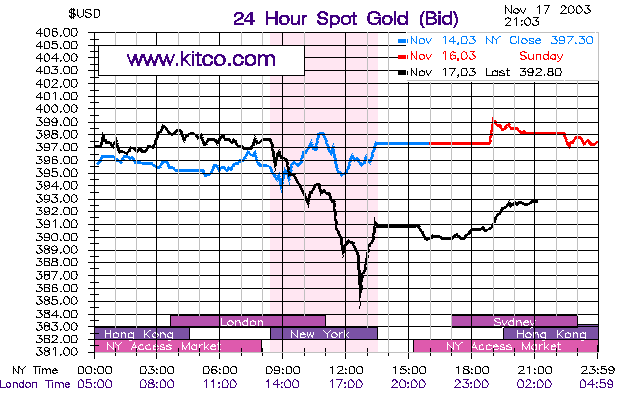
Gold
New York (21:03): Spot gold has had a highly volatile day, rising to 399, falling back to 385, and then recovering to $392.80.
The intermediate trend is up.
The primary trend is up. Expect resistance at 400 to 415.
New York (21:03): Spot gold has had a highly volatile day, rising to 399, falling back to 385, and then recovering to $392.80.
The intermediate trend is up.
The primary trend is up. Expect resistance at 400 to 415.
ASX Australia
The All Ordinaries is headed for a test of support at 3160,
falling 27 points to close at 3188 on average volume.
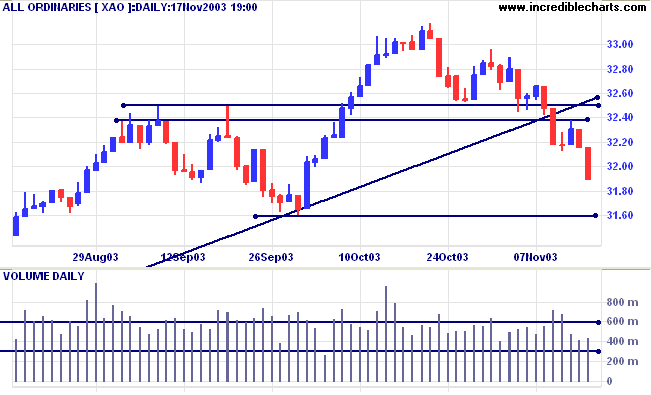
The intermediate trend is down.
MACD (26,12,9) is below its signal line; Slow Stochastic (20,3,3) has whipsawed back below its signal line.
Short-term: Bullish if the All Ords crosses back above resistance at 3250. Bearish below 3238.
MACD (26,12,9) is below its signal line; Slow Stochastic (20,3,3) has whipsawed back below its signal line.
Short-term: Bullish if the All Ords crosses back above resistance at 3250. Bearish below 3238.
The primary trend is up but will reverse if there is a fall below
3160 (the October 1 low). XAO is below the supporting trendline,
signaling weakness. Twiggs Money Flow (100) signals strong
distribution, after a bearish triple
divergence.
Intermediate term: Bullish above 3250. Bearish below 3160.
Long-term: Bearish below 3160.
Intermediate term: Bullish above 3250. Bearish below 3160.
Long-term: Bearish below 3160.
Ventracor [VCR]
Last covered on October 30,2003.
VCR has crossed below the primary supporting trendline after correcting off the blow-off (accelerating trend/spike) at [a]. Twiggs Money Flow (100) has crossed below zero, signaling strong distribution.
Last covered on October 30,2003.
VCR has crossed below the primary supporting trendline after correcting off the blow-off (accelerating trend/spike) at [a]. Twiggs Money Flow (100) has crossed below zero, signaling strong distribution.
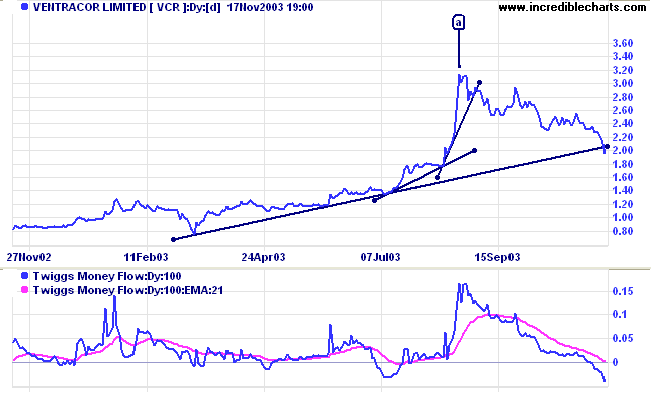
Relative Strength (xao) is falling rapidly, another strong bear
signal.
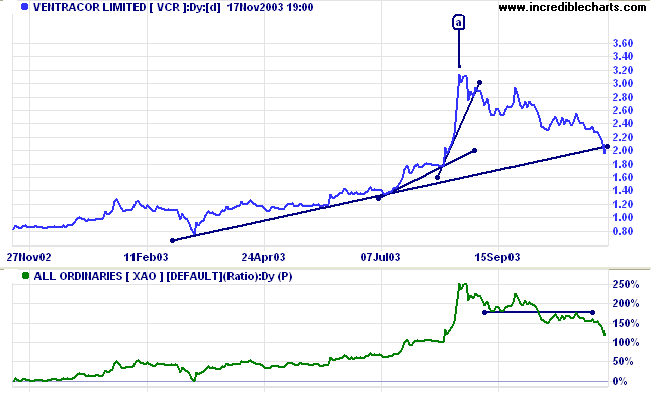
If price respects the trendline from below, the next major
support level is at 0.80.
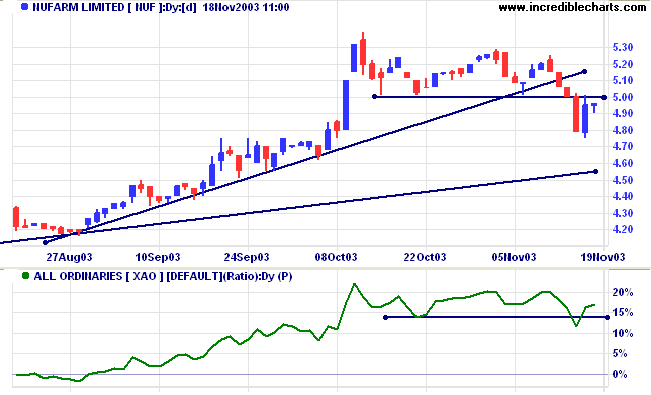
Nufarm [NUF]
NUF broke briefly above the major 5.00 resistance level before retreating below.
Twiggs Money Flow (100) has crossed to below its signal line after a healthy rise.
NUF broke briefly above the major 5.00 resistance level before retreating below.
Twiggs Money Flow (100) has crossed to below its signal line after a healthy rise.
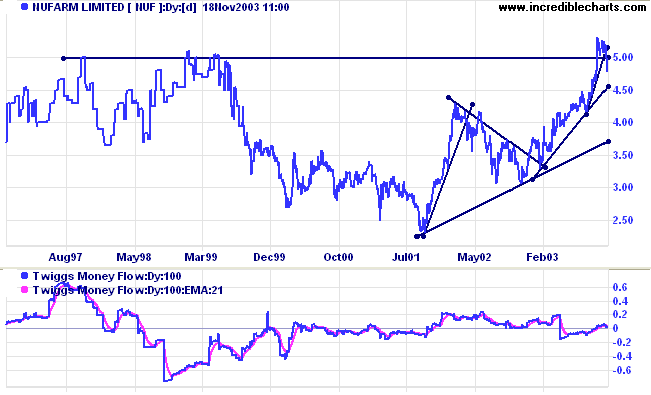
Long-term resistance became support at 5.00 after the breakout.
The level failed on the fourth test, signaling concerted selling.
Support has once again become resistance; failure to break
through this level (on the next pull-back) will be a bear
signal.
Relative Strength (xao) has crossed back above the RS support level, leaving some hope for the bulls. A peak below the RS support level will be a strong bear signal.
Relative Strength (xao) has crossed back above the RS support level, leaving some hope for the bulls. A peak below the RS support level will be a strong bear signal.
Understanding
the Trading Diary has been expanded to offer further
assistance to readers, including directions on how to search the
archives.
Colin Twiggs
Nothing is so new as what has long been
forgotten.
~ German proverb.
~ German proverb.
US Stock charts
We are busy with the transfer to the new dual-CPU server
and expect to have the charts available this week.
Back Issues
You can now view back issues at the Daily Trading Diary Archives.
You can now view back issues at the Daily Trading Diary Archives.
Back Issues
Access the Trading Diary Archives.