
Trading Diary
November 12, 2003
These extracts from my daily trading diary are
for educational purposes and should not be interpreted as
investment advice. Full terms and conditions can be found at
Terms
of Use .
USA
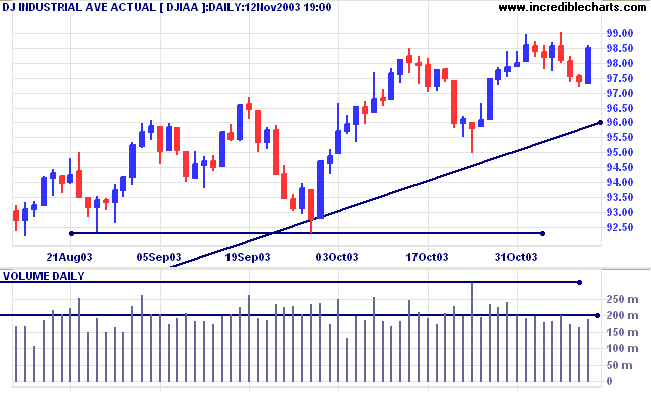
The Dow Industrial Average rallied sharply to close up more than
1.0% at 9849. Low volume signals a lack of commitment from
buyers.
The intermediate trend is down.
The primary trend is up. A fall below 9000 would signal reversal.
The intermediate trend is down.
The primary trend is up. A fall below 9000 would signal reversal.
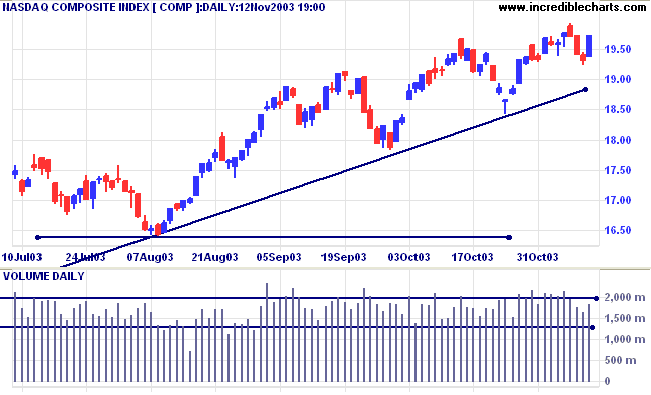
The Nasdaq Composite rallied 42 points to close at 1973.
The intermediate trend is up. Expect resistance at 2000 to 2060.
The primary trend is up. A fall below 1640 will signal reversal.
The intermediate trend is up. Expect resistance at 2000 to 2060.
The primary trend is up. A fall below 1640 will signal reversal.
The S&P 500 rallied 12 points to close at 1059 on higher
volume.
The intermediate trend is up. Expect some resistance at 1100, a significant support level from 2001/02.
Short-term: Bullish if the S&P500 is above 1048 (Tuesday's High).
The intermediate trend is up. Expect some resistance at 1100, a significant support level from 2001/02.
Short-term: Bullish if the S&P500 is above 1048 (Tuesday's High).
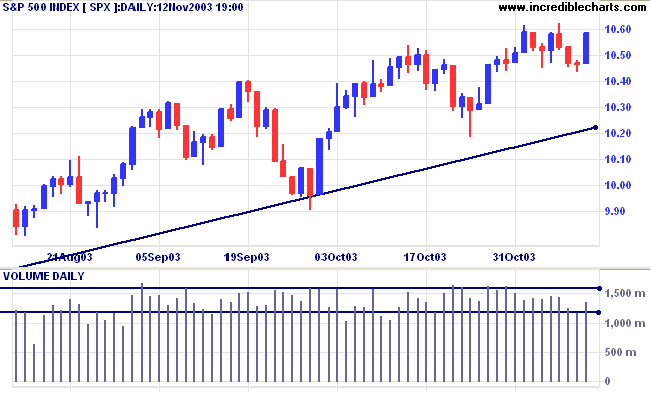
The primary trend on the S&P 500 is up. A fall below 960 will
signal reversal (the low from the secondary correction in
August).
Intermediate: Bullish above 1062 (Friday's High). Long-term: Bullish above 960.
Intermediate: Bullish above 1062 (Friday's High). Long-term: Bullish above 960.
The Chartcraft NYSE Bullish % Indicator increased
slightly to 81.04% (November 12).
A 3-box reversal would signal a bear alert.
A 3-box reversal would signal a bear alert.
US dollar boosts gold
The weakening US dollar, and the cheaper bullion price in euros and yen, have fuelled a rise in spot gold. (more)
The weakening US dollar, and the cheaper bullion price in euros and yen, have fuelled a rise in spot gold. (more)
Treasury yields
The yield on 10-year treasury notes closed down slightly at 4.41%.
The intermediate trend is up. The recent high is only marginally above the previous high on October 16th, signaling possible weakness.
The primary trend is up.
The yield on 10-year treasury notes closed down slightly at 4.41%.
The intermediate trend is up. The recent high is only marginally above the previous high on October 16th, signaling possible weakness.
The primary trend is up.
Gold
New York (19:39): Spot gold jumped to $394.00.
The intermediate trend is up.
The primary trend is up. Expect resistance at 400 to 415.
New York (19:39): Spot gold jumped to $394.00.
The intermediate trend is up.
The primary trend is up. Expect resistance at 400 to 415.
ASX Australia
The All Ordinaries has encountered buying support, consolidating
at 3217 on strong volume.
MACD (26,12,9) and Slow Stochastic (20,3,3) are both below their signal lines.
MACD (26,12,9) and Slow Stochastic (20,3,3) are both below their signal lines.
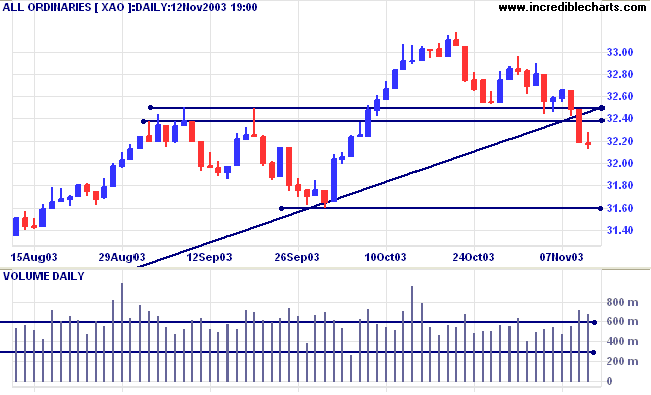
The intermediate trend is down but a swing back above the 3238 to
3250 band of resistance would be bullish.
Short term: Bearish below 3238; Bullish above 3250.
The index has penetrated the primary trendline and a fall below support at 3160 will signal reversal. The primary trend is up but the rally is extended. Probability of a reversal increases with each successive primary trend movement.
Intermediate: Bearish below 3160; Bullish above 3250. Long-term: Bearish below 3160.
Oxiana [OXR]
Last covered September 9, 2003.
Oxiana has been in a stage 2 up-trend for the past 3 years and now threatens to accelerate into a spike (or blow-off), normally followed by a sharp reversal. Warning signs are: 4 or more trendlines of increasing slope; increased volume on the up-swing; frequent gaps; and short corrections, not longer than 2 days.
Twiggs Money Flow (100) signals strong accumulation, remaining above zero for over 2 years.
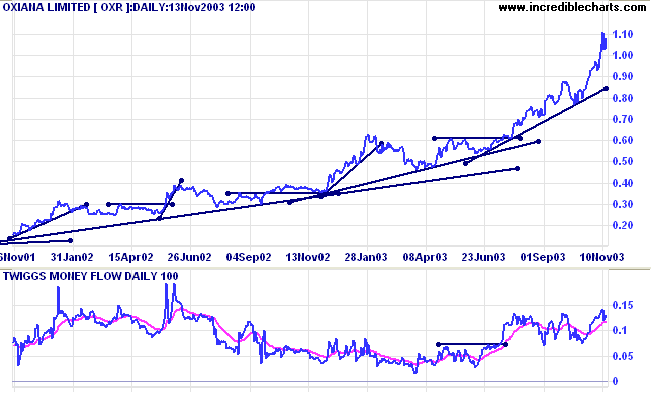
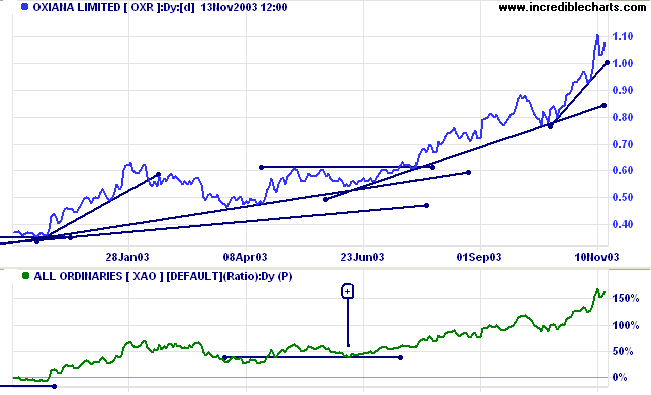
Relative Strength (xao) continues to rise.
The earlier entry signal [+] came from price respecting the second trendline, rising RS, and a dry-up of volume and volatility at the reversal.
The earlier entry signal [+] came from price respecting the second trendline, rising RS, and a dry-up of volume and volatility at the reversal.
The latest correction [c] displays very heavy volume when
compared to [a] and [b] on the equivolume chart. All lasted two
days but the increased volume should be a warning to lock in
profits. The obvious place for a stop loss is just below 1.00 but
just be aware that it is obvious and therefore may be subject to
attack by day-traders.
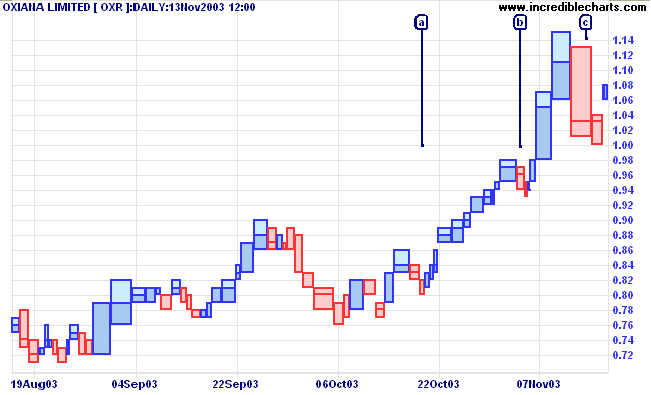
If rallies above 1.15, I will consider introducing a
trailing % stop at 6% if there are signs of a blow-off.
A close (or a fall on heavy volume) below 1.00 will be a bear signal.
A close (or a fall on heavy volume) below 1.00 will be a bear signal.
Understanding
the Trading Diary has been expanded to offer further
assistance to readers, including directions on how to search the
archives.
Colin Twiggs
I don't make jokes.
I just watch the government and report the facts.
~ Will Rogers, American cowboy humorist (1879 - 1935).
I just watch the government and report the facts.
~ Will Rogers, American cowboy humorist (1879 - 1935).
Market Strategy
Please give me feedback/suggestions on the presentation of Market Strategy.
Is it an improvement or do you prefer the old way?
There is a thread at Trading Diary on the Chart Forum.
Please give me feedback/suggestions on the presentation of Market Strategy.
Is it an improvement or do you prefer the old way?
There is a thread at Trading Diary on the Chart Forum.
Back Issues
You can now view back issues at the Daily Trading Diary Archives.
You can now view back issues at the Daily Trading Diary Archives.
Back Issues
Access the Trading Diary Archives.