
Trading Diary
November 11, 2003
These extracts from my daily trading diary are
for educational purposes and should not be interpreted as
investment advice. Full terms and conditions can be found at
Terms
of Use .
USA
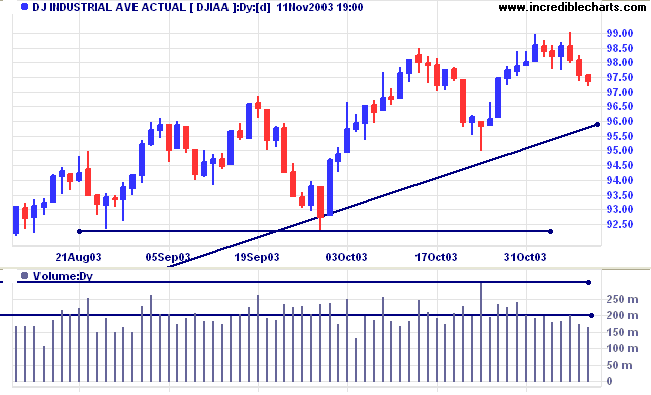
The Dow Industrial Average eased slightly to close at 9738. Low
volume and shrinking volatility (daily range) signal a lack of
commitment from sellers.
The intermediate trend is down.
The primary trend is up. A fall below 9000 would signal reversal.
The intermediate trend is down.
The primary trend is up. A fall below 9000 would signal reversal.
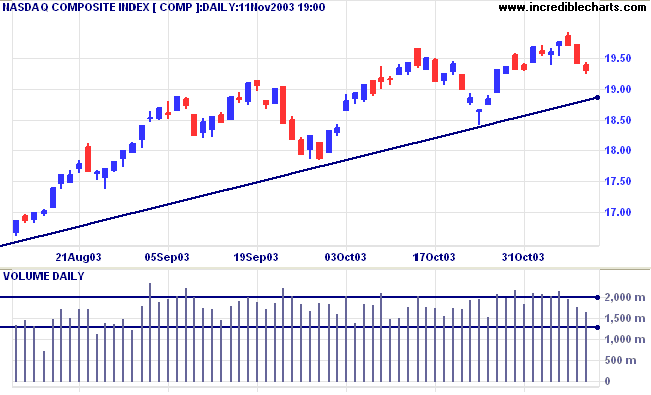
The Nasdaq Composite closed 11 points lower at 1931. Again,
declining volume and volatility signal a lack of enthusiasm from
sellers.
The intermediate trend is up. Expect resistance at 2000 to 2060.
The primary trend is up. A fall below 1640 will signal reversal.
The intermediate trend is up. Expect resistance at 2000 to 2060.
The primary trend is up. A fall below 1640 will signal reversal.
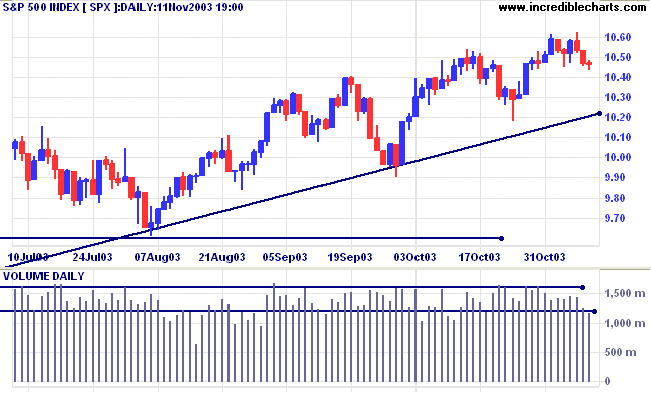
The S&P 500 closed almost unchanged at 1047. The dry-up of
volume and volatility signals a lack of sellers.
The intermediate trend is up. Expect resistance at 1100, a significant support level from 2001/02.
The primary trend is up. A fall below 960 will signal reversal (the low from the secondary correction in August).
The intermediate trend is up. Expect resistance at 1100, a significant support level from 2001/02.
The primary trend is up. A fall below 960 will signal reversal (the low from the secondary correction in August).
The Chartcraft NYSE Bullish % Indicator declined
to 81.00% (November 11).
Market Strategy
Short-term: Bullish if the S&P500 is above 1048 (Tuesday's High). Bearish below 1043 (Tuesday's Low).
Intermediate: Bullish above 1062 (Friday's High).
Long-term: Bullish above 960.
Short-term: Bullish if the S&P500 is above 1048 (Tuesday's High). Bearish below 1043 (Tuesday's Low).
Intermediate: Bullish above 1062 (Friday's High).
Long-term: Bullish above 960.
Treasury yields
There was no trade on CBOE interest rate instruments on Tuesday. The yield on 10-year treasury notes on Monday was 4.46%.
The intermediate trend is up.
The primary trend is up.
There was no trade on CBOE interest rate instruments on Tuesday. The yield on 10-year treasury notes on Monday was 4.46%.
The intermediate trend is up.
The primary trend is up.
Gold
New York (19:39): Spot gold continues to rise, currently at $387.60.
The intermediate trend is up.
The primary trend is up. Expect resistance at 400 to 415.
New York (19:39): Spot gold continues to rise, currently at $387.60.
The intermediate trend is up.
The primary trend is up. Expect resistance at 400 to 415.
ASX Australia
The All Ordinaries broke through support at 3238 to 3250, falling
30 points to close at 3218 on strong volume.
MACD (26,12,9) and Slow Stochastic (20,3,3) are both below their signal lines, while Twiggs Money Flow (100) has crossed below zero after a bearish triple divergence.
MACD (26,12,9) and Slow Stochastic (20,3,3) are both below their signal lines, while Twiggs Money Flow (100) has crossed below zero after a bearish triple divergence.
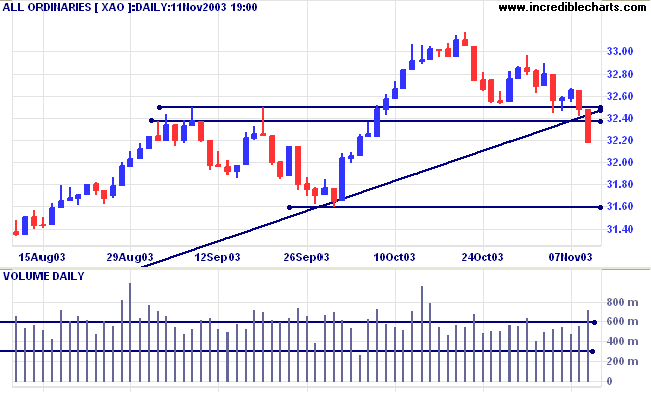
A secondary correction (in fact any correction)
faces two immediate support levels:
-
At the previous peak (3238 to 3250 on the
above chart), where former resistance has become support.
Failure to penetrate this initial level (often roughly a 50%
retracement) signals a strong up-trend.
- At the previous support level (3160 to 3165 on the above chart), from the last trough. When the index has retraced 100% of the previous up-swing. Penetration will signal a primary trend reversal; while failure to do so will most likely result in a consolidation pattern before continuation of the up-trend.
Market Strategy
Short-term: Bearish below 3238.
Intermediate: Bearish below 3160. Bullish above 3250. The intermediate trend is down but a swing back above resistance would be bullish.
Long-term: Bearish below 3160. The index has penetrated the primary trendline and a fall below support at 3160 will signal reversal. The primary trend is up but the rally is extended: probability of a reversal increases with each successive primary trend movement.
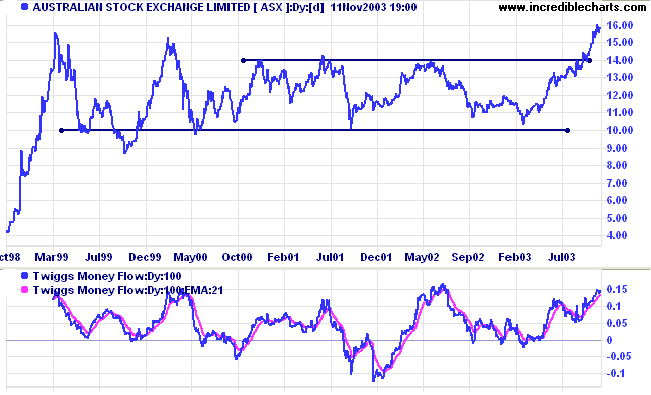
Australian Stock exchange [ASX]
Last covered September 8, 2003.
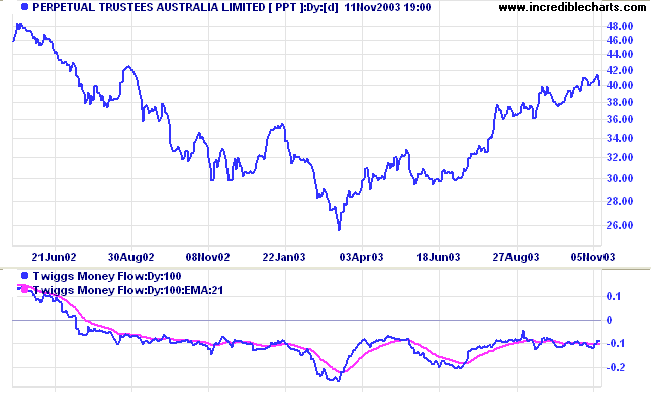
Within the Financial-x-Property sector [XXJ] there are two industries that have run counter to the dominant banking industry: Investment and Insurance.
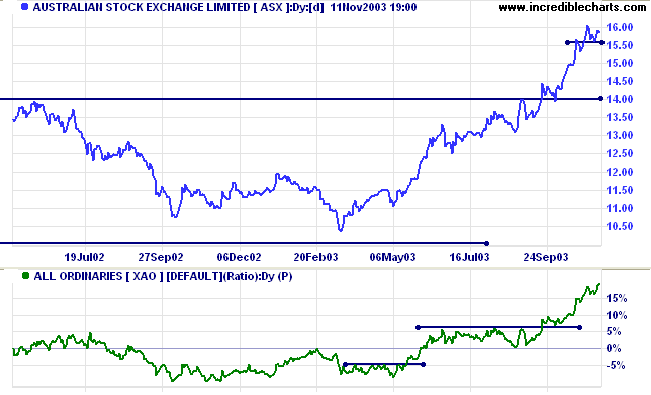
ASX has broken out of a long-term trading range, while Twiggs Money Flow (100) is bullish, having completed a higher low - higher high sequence.
Last covered September 8, 2003.
Within the Financial-x-Property sector [XXJ] there are two industries that have run counter to the dominant banking industry: Investment and Insurance.
ASX has broken out of a long-term trading range, while Twiggs Money Flow (100) is bullish, having completed a higher low - higher high sequence.
Relative Strength (xao) continues to rise.
It would be prudent to wait for a pull-back that respects support at 14.00.
It would be prudent to wait for a pull-back that respects support at 14.00.
However, Twiggs Money Flow (100) has been lurking below the zero
line for the past 12 months and does not appear to be rising; a
strong bear signal.
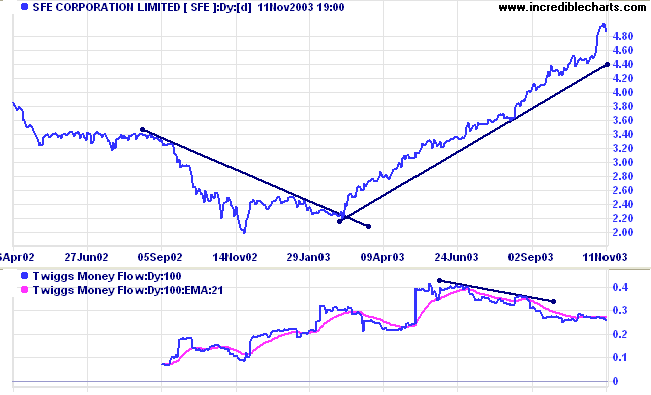
Sydney Futures Exchange [SFE]
SFE is also in a strong up-trend with Twiggs Money Flow (100) displaying a bearish divergence.
SFE is also in a strong up-trend with Twiggs Money Flow (100) displaying a bearish divergence.
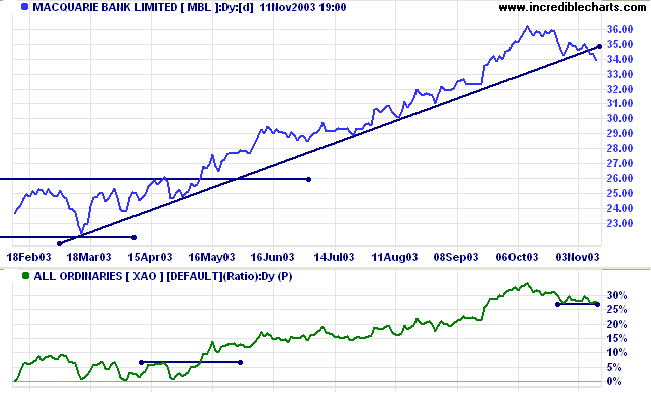
Macquarie [MBL]
Last covered January 14, 2003.
Macquarie Bank broke below its primary supporting trendline while Relative Strength (xao) is weakening.
Last covered January 14, 2003.
Macquarie Bank broke below its primary supporting trendline while Relative Strength (xao) is weakening.
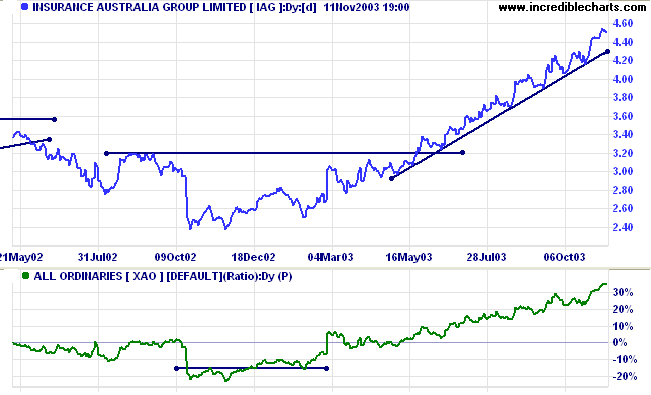
Insurance Australia [IAG]
Last covered on August 20, 2002.
IAG displays a strong up-trend with Twiggs Money Flow (100) signaling accumulation.
Last covered on August 20, 2002.
IAG displays a strong up-trend with Twiggs Money Flow (100) signaling accumulation.
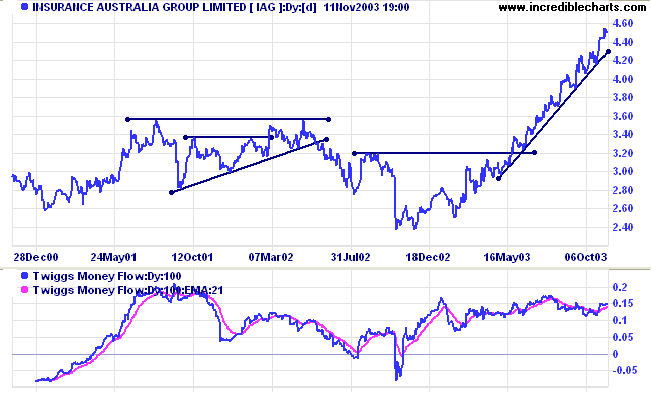
Relative Strength (xao) is rising strongly.
The trend is extended and I am hoping for a pull-back soon.
The trend is extended and I am hoping for a pull-back soon.
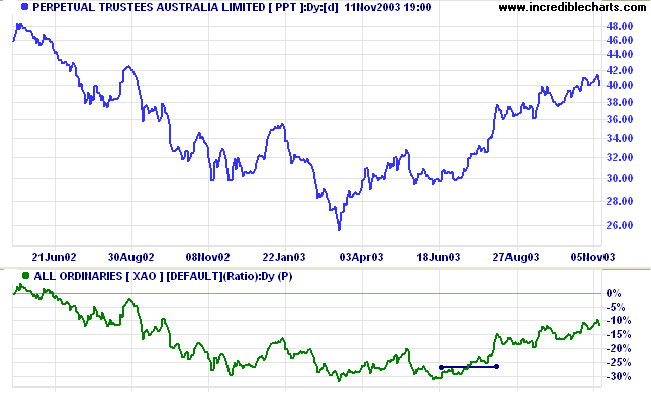
QBE Insurance [QBE]
Last covered on May 5, 2003.
QBE displays a similar strong up-trend, with Relative Strength (xao) rising. But Twiggs Money Flow (100) signals a bearish divergence.
Last covered on May 5, 2003.
QBE displays a similar strong up-trend, with Relative Strength (xao) rising. But Twiggs Money Flow (100) signals a bearish divergence.
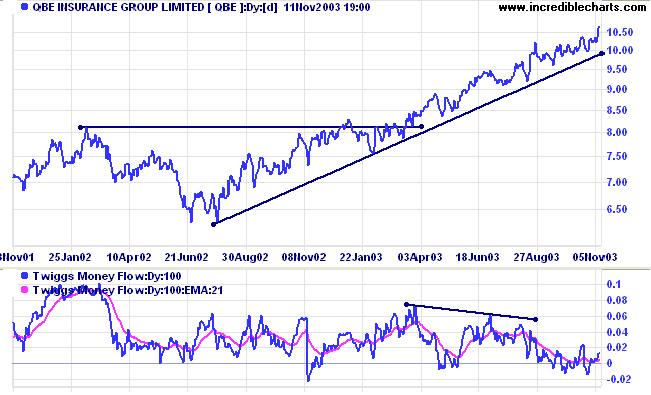
I have saved the above chart with log scale. This is not a sudden
conversion. I have been flipping backwards and forwards between
log and linear scale, searching for examples for the Chart Forum,
and simply lost track.
Understanding
the Trading Diary has been expanded to offer further
assistance to readers, including directions on how to search the
archives.
Colin Twiggs
Why should anyone outside a lunatic asylum use
money as a store of wealth?
~ John Maynard Keynes: in a letter to J.Viner.
~ John Maynard Keynes: in a letter to J.Viner.
Linear vs. Log Charts
There is a lively debate on the Chart Forum at Chart Patterns: Linear vs Log.
The discussion has focused on trendlines (and some interesting interpretations):
Do you prefer to draw trendlines on Linear (Normal) or Log scale charts?
There is a lively debate on the Chart Forum at Chart Patterns: Linear vs Log.
The discussion has focused on trendlines (and some interesting interpretations):
Do you prefer to draw trendlines on Linear (Normal) or Log scale charts?
Back Issues
You can now view back issues at the Daily Trading Diary Archives.
You can now view back issues at the Daily Trading Diary Archives.
Back Issues
Access the Trading Diary Archives.