|
Incredible Charts version
4.0.2.500 The new version is now available. Check Help>>About to ensure that your software has been automatically updated. The update offers further improvements to the watchlist menu, powerful new scrolling features and supports the use of Large Font settings on laptop (and desktop) computers. See What's New? for further details. |
Trading Diary
September 9, 2003
These extracts from my daily trading diary
are for educational purposes
only and should not be
interpreted as investment advice. Full terms and conditions can
be found at Terms
of Use .
USA
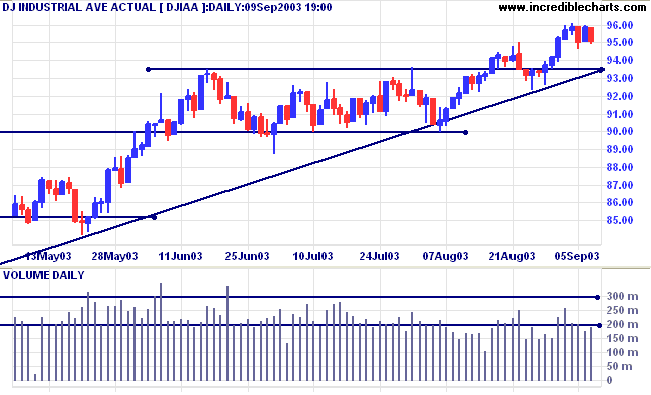
The Dow Industrial Average again tested support at 9500, closing
at 9507 on low volume. If the index respects this support level,
we will see a fast up-trend. If support is broken the index will
likely correct back to test the supporting trendline.
The intermediate trend is up.
The primary trend is up.
The intermediate trend is up.
The primary trend is up.
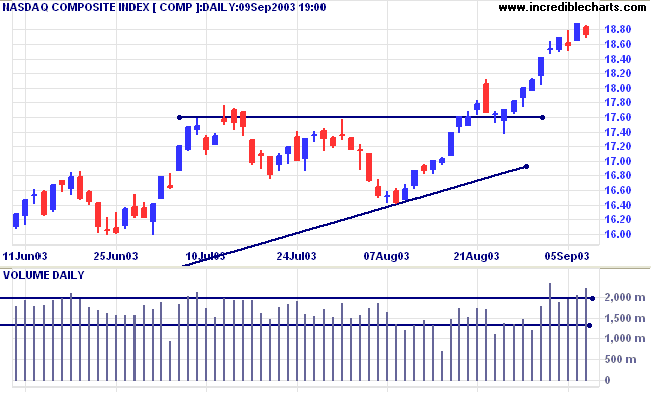
The Nasdaq Composite signaled increased selling pressure with an
inside day on strong volume, closing 16 points lower at
1873.
The intermediate trend is up.
The primary trend is up.
The intermediate trend is up.
The primary trend is up.
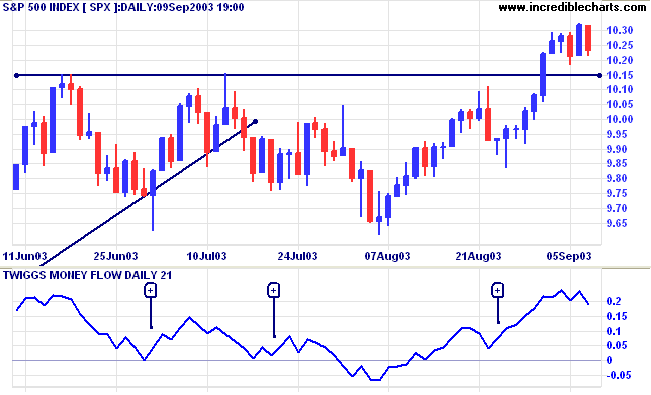
The S&P 500 lost 9 points to close at 1023 on average volume,
possibly headed for a test of support at 1015.
The intermediate trend is up.
The primary trend is up.
The intermediate trend is up.
The primary trend is up.
The Chartcraft NYSE Bullish % Indicator is at a
10-year high of 80.11% (September 9).
Market Strategy
Short-term: Long if the S&P500 is above 1032.
Intermediate: Long if S&P 500 is above 1015.
Long-term: Long is the index is above 960.
Short-term: Long if the S&P500 is above 1032.
Intermediate: Long if S&P 500 is above 1015.
Long-term: Long is the index is above 960.
Treasury yields
The yield on 10-year treasury notes closed almost unchanged at 4.37%.
The yield is ranging just above the support level, a bullish sign.
The primary trend is up.
The yield on 10-year treasury notes closed almost unchanged at 4.37%.
The yield is ranging just above the support level, a bullish sign.
The primary trend is up.
Gold
New York (20.22): Spot gold climbed to test overhead resistance at 382, before retreating to $381.00.
The primary trend is up.
Price has broken above a symmetrical triangle formed since the start of the year. If gold penetrates overhead resistance at 382, the target is the 10-year high of 420.
New York (20.22): Spot gold climbed to test overhead resistance at 382, before retreating to $381.00.
The primary trend is up.
Price has broken above a symmetrical triangle formed since the start of the year. If gold penetrates overhead resistance at 382, the target is the 10-year high of 420.
ASX Australia
The All Ordinaries closed up 5 points at 3238 on average volume,
forming a gravestone
reversal signal.
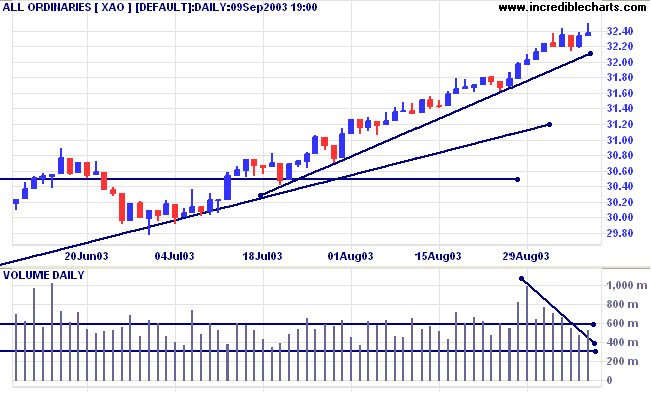
The intermediate and primary trends are up.
MACD (26,12,9) is above its signal line; Slow Stochastic (20,3,3) has whipsawed above; Twiggs Money Flow shows a bearish divergence.
MACD (26,12,9) is above its signal line; Slow Stochastic (20,3,3) has whipsawed above; Twiggs Money Flow shows a bearish divergence.
Market Strategy
Short-term: Long above 3250.
Intermediate: Long if the index is above 3160.
Long-term: Long if the index is above 2978 .
Short-term: Long above 3250.
Intermediate: Long if the index is above 3160.
Long-term: Long if the index is above 2978 .
Gold stocks
An update on how gold stocks are performing:
An update on how gold stocks are performing:
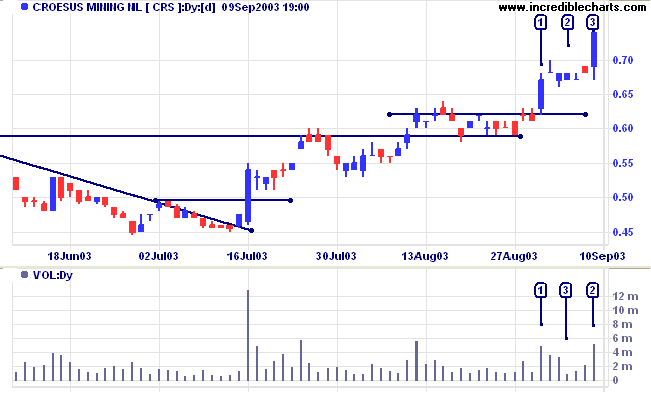
Croesus [CRS] was last covered on August 27, 2003. Since then it has broken
out of the bullish consolidation pattern at [1], accompanied by
reasonable volume. There was a short consolidation at [2], with
low volume and volatility, signaling a fast up-trend. This was
confirmed by another strong up-day at [3]. Overhead resistance is
at 0.85 to 0.95.
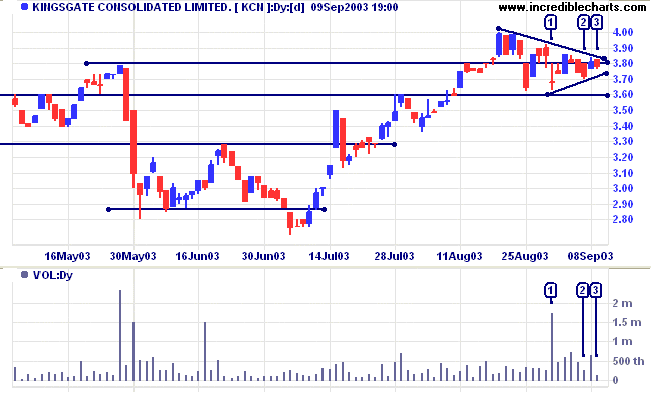
Kingsgate [KCN] was last covered on August 27, 2003. Price has since
consolidated between 3.60 and 4.00 forming a bullish pennant.
Strong volume at [1] signals buying support above 3.60. Volume
has dried up on subsequent corrections at [2] and [3]; a further
bullish signal.
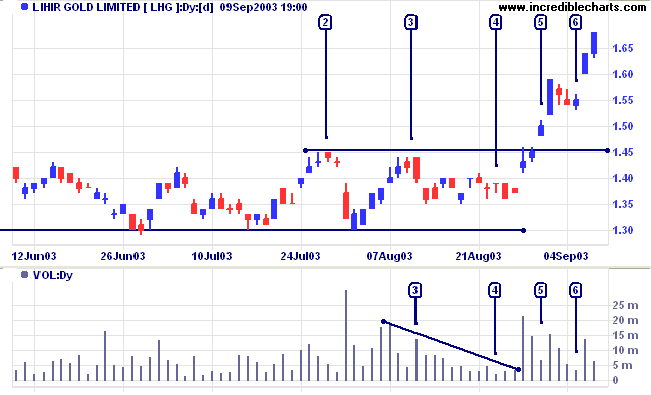
Lihir [LHG], covered August 27,
2003, held above support at 1.30, despite several bearish
signals, and broke through resistance at 1.45. Price gapped up
for two consecutive days at [5] but on light volume. However, LHG
then formed a small pennant consolidation on low volume at [6],
signaling a fast up-trend.
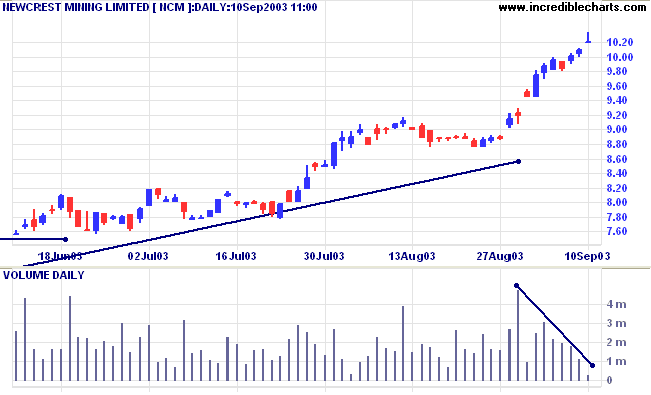
Newcrest [NCM], covered August 28,
resumed its' fast up-trend. Declining volume on the latest rally
warns of another correction.
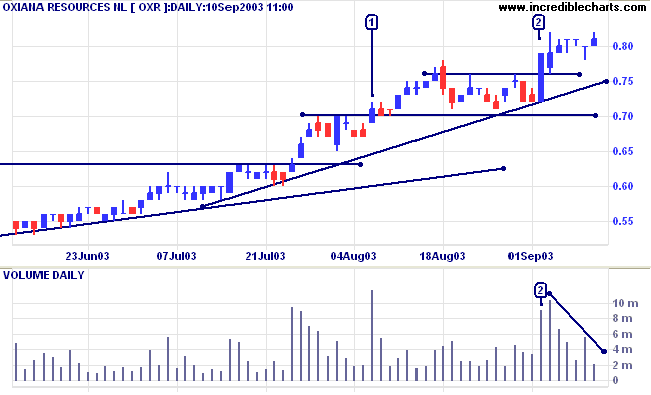
Oxiana [OXR], covered August 28,
broke through resistance at 0.76 on strong volume at [2]. A weak
close and strong volume on the next day indicate selling
pressure, but volume has dried up on the consolidation between
0.76 and 0.82, signaling continuation.
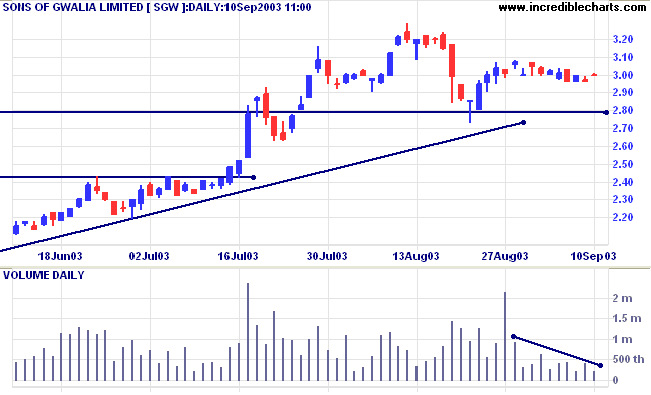
Sons of Gwalia [SGW], covered August
28, is consolidating above support at 2.80 on low volume. A
rise above 3.25 will be bullish. A close below 2.80 would be
bearish.
Understanding
the Trading Diary has been expanded to offer further
assistance to readers.
Colin Twiggs
It is not necessary to do extraordinary things
to get extraordinary results.
~ Warren Buffet.
~ Warren Buffet.
Scrolling through data history
|
On the right of the toolbar there are four
(horizontal) scrolling arrows. To scroll directly to the start of the data, click the first arrow |<. To scroll forward, day-by-day or week-by-week, click the third arrow >. To scroll back, use the second <. To return to the latest data, click >|. To change the scrolling interval, select View >> Scroll Period. |
Back Issues
You can now view back issues at the Daily Trading Diary Archives.
You can now view back issues at the Daily Trading Diary Archives.
Back Issues
Access the Trading Diary Archives.