| Money Management |
| The best trades are those where you can place a stop loss underneath a logical support level and within 5% of your entry point. When I refer to a logical support level I mean a recent trough in a pattern or an up-trend, above which price is likely to hold, and not a moving average. |
Trading Diary
August 7, 2003
These extracts from my daily trading diary are
intended to illustrate the techniques used in short-term trading
and should not be interpreted as investment advice. Full terms
and conditions can be found at Terms
of Use .
USA
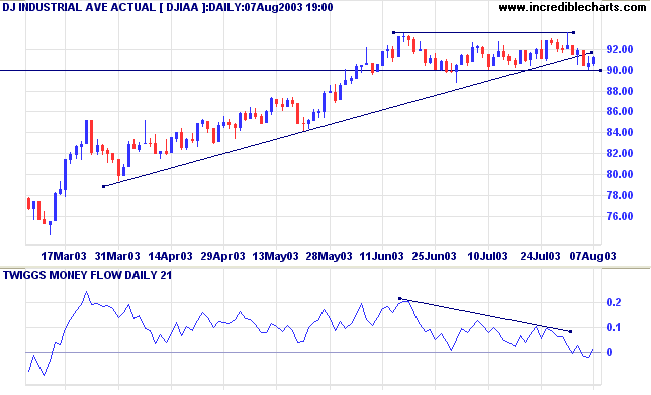
The Dow closed 0.7% higher at 9126 but on lower
volume.
The intermediate trend is up. The index has penetrated the supporting trendline but is consolidating above the 9000 support level, a bullish sign. A break below 9000 will signal a reversal.
MACD and Twiggs Money show bearish divergences, though TMF has crossed back above zero.
The primary trend is up.
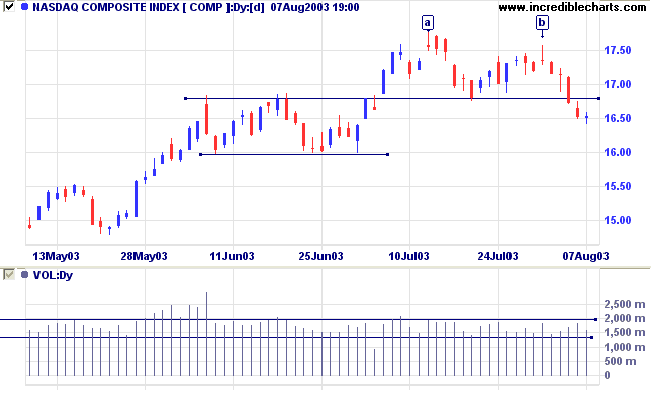
The Nasdaq Composite formed a doji, signaling indecision. The
index closed 1 point lower at 1652 on lower volume.
The intermediate trend is down. Support is at 1600.
The primary trend is up.
The intermediate trend is down. Support is at 1600.
The primary trend is up.
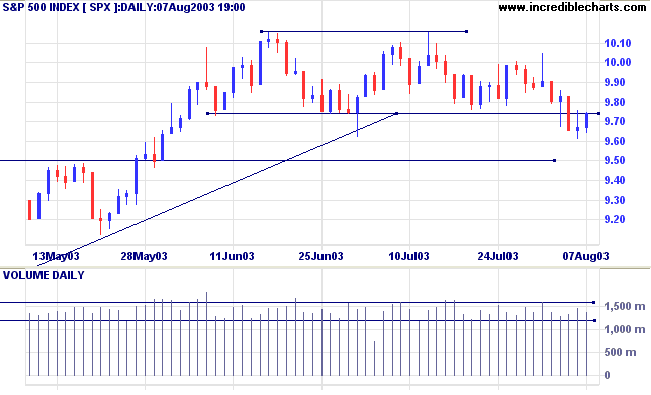
The S&P 500 re-tested resistance, closing at the 974 level
but failing to break through.
The intermediate trend is down.
MACD and Twiggs Money Flow (21) display bearish divergences.
The primary trend is up.
The intermediate trend is down.
MACD and Twiggs Money Flow (21) display bearish divergences.
The primary trend is up.
The Chartcraft NYSE Bullish % Indicator lost
another 0.25% to close at 74.25% (August 6).
Market Strategy
Short-term: Long if the S&P500 is above 1000. Short if below 964.
Intermediate: Long if S&P 500 is above 1000. Short if below 950.
Long-term: Long is the index is above 1000.
Short-term: Long if the S&P500 is above 1000. Short if below 964.
Intermediate: Long if S&P 500 is above 1000. Short if below 950.
Long-term: Long is the index is above 1000.
Jobless claims
New unemployment claims eased slightly to 390,000, remaining below the key 400,000 level. (more)
New unemployment claims eased slightly to 390,000, remaining below the key 400,000 level. (more)
Treasury yields
The yield on 10-year treasury notes continues to weaken, closing at 4.23%.
The intermediate and primary trends are both up.
The yield on 10-year treasury notes continues to weaken, closing at 4.23%.
The intermediate and primary trends are both up.
Gold
New York (17.27): Spot gold closed slightly up at $352.30.
The primary trend is still upwards.
New York (17.27): Spot gold closed slightly up at $352.30.
The primary trend is still upwards.
ASX Australia
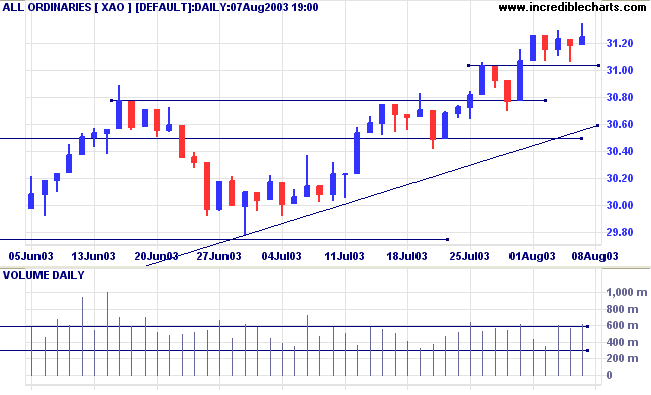
The All Ordinaries continues to display indecision, failing to
make progress despite strong volume. The index closed 6 points
higher at 3125.
The intermediate trend is up. A fall below 2978 would signal a reversal.
The primary trend is up.
Slow Stochastic (20,3,3) is below its signal line; MACD (26,12,9) is above; Twiggs Money Flow signals accumulation.
The intermediate trend is up. A fall below 2978 would signal a reversal.
The primary trend is up.
Slow Stochastic (20,3,3) is below its signal line; MACD (26,12,9) is above; Twiggs Money Flow signals accumulation.
Market Strategy
Short-term: Long if the All Ords is above 3127. Short if the index falls below 2978.
Intermediate: Long if the index is above 3127.
Long-term: Long if the index is above 2978 .
Short-term: Long if the All Ords is above 3127. Short if the index falls below 2978.
Intermediate: Long if the index is above 3127.
Long-term: Long if the index is above 2978 .
Energy [XEJ]
Energy stocks are in a stage 2 up-trend. The three stocks with highest 1-year Relative Strength are:
Energy stocks are in a stage 2 up-trend. The three stocks with highest 1-year Relative Strength are:
Amity Oil [AYO]
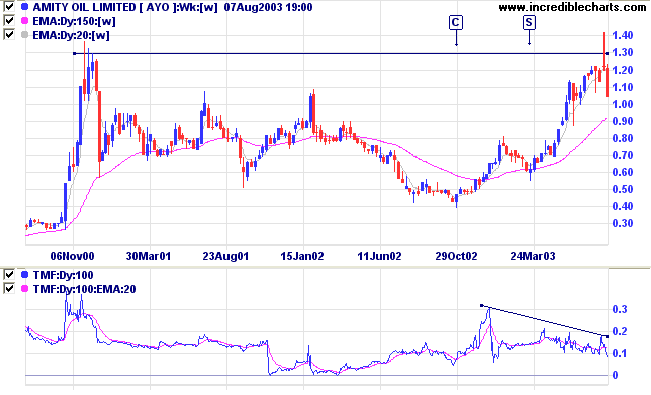
Amity has tested the highs reached almost 3 years ago in late 2000. Note the cup and saucer at [C] and [S].
Twiggs Money Flow (100) and MACD show bearish divergences.
Amity has tested the highs reached almost 3 years ago in late 2000. Note the cup and saucer at [C] and [S].
Twiggs Money Flow (100) and MACD show bearish divergences.
Relative Strength (price ratio: xao) has fallen sharply
after making a new 3-month high.
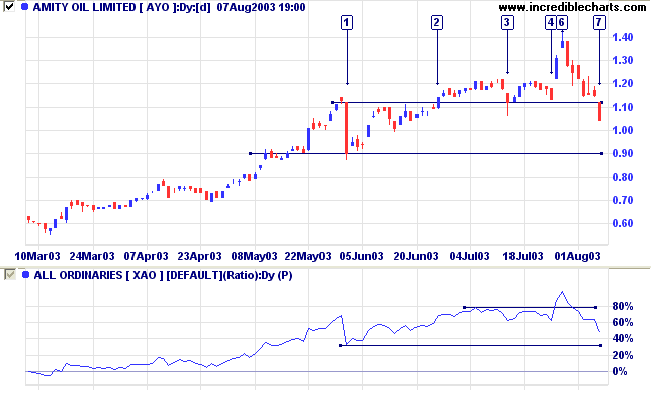
The daily volume chart displays a sharp correction back to
support at [1] after a tentative rally on light volume.
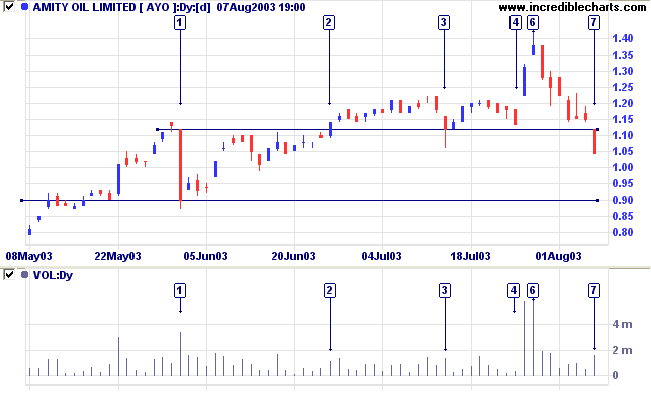
The breakout above resistance at [2] is accompanied by moderate volume, signaling weakness. We then had tests of the new support level: [3] made a false break while [4] showed a bullish dry-up of volume.
The rally to [6] gapped up on consecutive days on big volume, exhausting buying support, before correcting back to 1.12.
AYO has now gapped below the 1.12 support level and a test of support at .90 is likely.
If Amity respects support at 0.90, it may present opportunities
to accumulate while it consolidates above this level.
A close below 0.90 would be a strong bear signal.
A close below 0.90 would be a strong bear signal.
Caltex [CTX]
Last covered July 31, 2003.
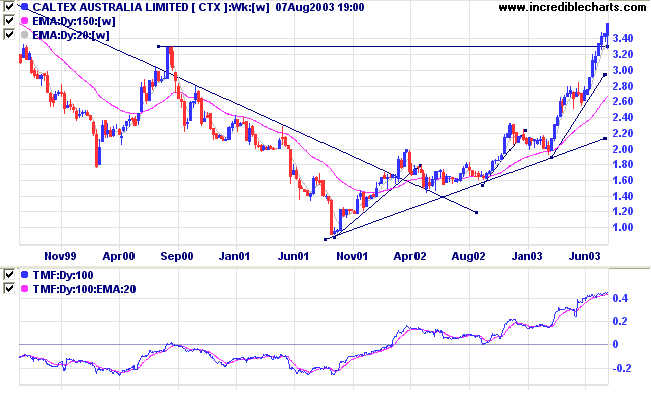
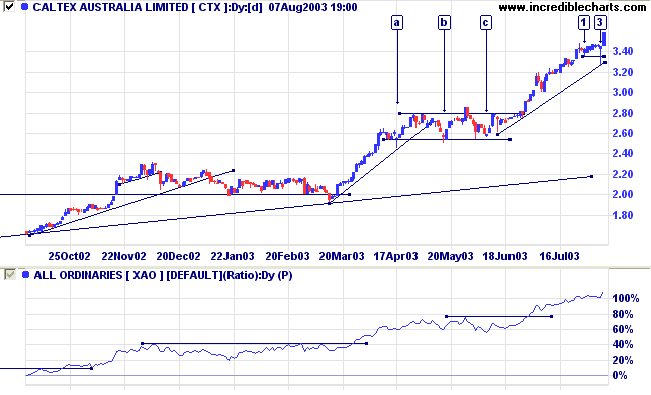
Caltex continues to rally strongly, brushing aside resistance at 3.30.
Twiggs Money Flow (100) and MACD continue to signal strong
accumulation.Last covered July 31, 2003.
Caltex continues to rally strongly, brushing aside resistance at 3.30.
Relative Strength (price ratio: xao) has made a new 3-month
high.
The strong up-trend has been running for some time and I was
expecting some type of correction (or consolidation) at the
3.30 level.
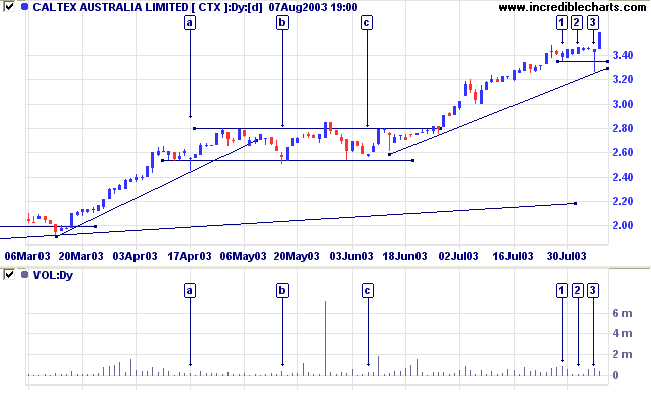
Price made a false break at [3], back below the previous low of [1], on moderate volume, before continuing with the rally.
A sense of deja vu prevails: a similar false break at [a] followed the previous rally.
Equal lows on low volume, as at [b] and [c], are a bullish sign in an up-trend, presenting opportunities to accumulate. Tight stops can be placed below the support level, within 5% of the entry point (above the high of [b] or [c]).
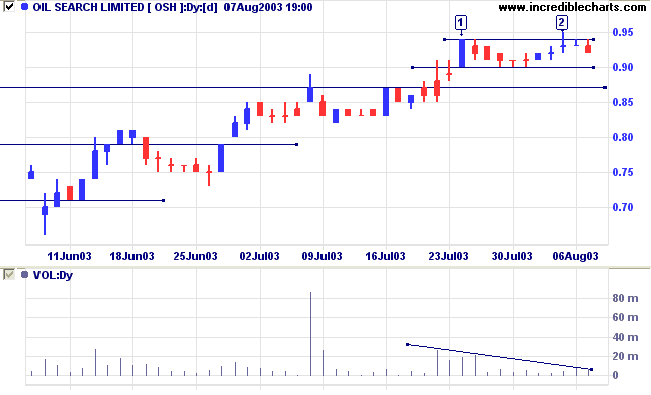
Oil Search [OSH]
Last covered on July 21, 2003.
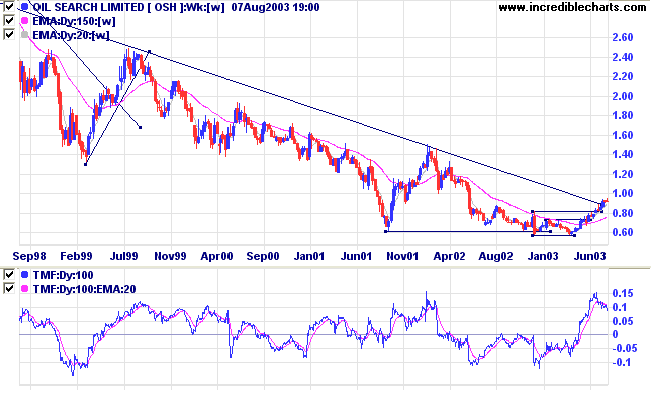
OSH has broken above the downward trendline after forming a broad stage 1 base.
Twiggs Money Flow (100) signals accumulation. MACD is bullish.
Last covered on July 21, 2003.
OSH has broken above the downward trendline after forming a broad stage 1 base.
Twiggs Money Flow (100) signals accumulation. MACD is bullish.
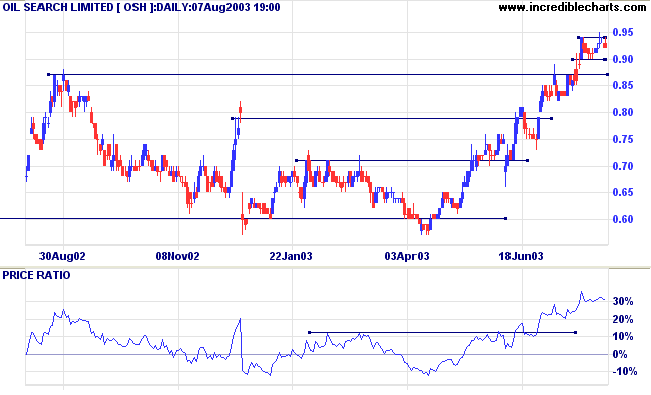
Relative Strength (price ratio: xao) is rising.
OSH has broken through resistance at 0.87 and now displays two equal highs.
OSH has broken through resistance at 0.87 and now displays two equal highs.
Equal highs are not particularly bearish when they occur in an
up-trend; unless price falls below the low of the intervening
trough, completing a double top. However, there is a dry-up of
volume on the second high at [2], accompanied by weak closes,
and we are likely to see a re-test of support at 0.90 and
0.87.
Longer-term traders should wait for a secondary correction before accumulating.
A fall below 0.77 would be bearish.
Longer-term traders should wait for a secondary correction before accumulating.
A fall below 0.77 would be bearish.
Understanding
the Trading Diary has been expanded to offer further
assistance to readers.
Colin Twiggs
Rules Conditional # 5
Quiet weak markets are good markets to sell. They ordinarily
develop into declining markets. But when a market has gone on
through the stages of quiet and weak to active and declining,
then on to semi-panic or panic, it should be bought freely.
When, vice versa, a quiet and firm market develops into
activity and strength, then into excitement, it should be
sold with great confidence.
~ SA Nelson: The ABC of Stock Speculation (1903).
| Stock Screens: Sector Analysis |
|
Stock screens can be used to analyze
stocks in a specific sector. To determine the Relative
Strength of stocks in, for example, the Energy
sector: (1) Select Energy in the Sector box; (2) Enter 9999 as the 1-year Maximum % Price Move; (3) Submit; (4) Sort the Results by clicking on the %M(1Y) header. Stocks with the highest values will have the greatest relative strength. |
Back Issues
You can now view back issues at the Daily Trading Diary Archives.
You can now view back issues at the Daily Trading Diary Archives.
Back Issues
Access the Trading Diary Archives.