| Delayed Diary |
|
Apologies for the late diary. We
experienced an error on the server web pages and had to wait for all cache servers to clear. |
Trading Diary
August 4, 2003
These extracts from my daily trading diary are
intended to illustrate the techniques used in short-term trading
and should not be interpreted as investment advice. Full terms
and conditions can be found at Terms
of Use .
USA
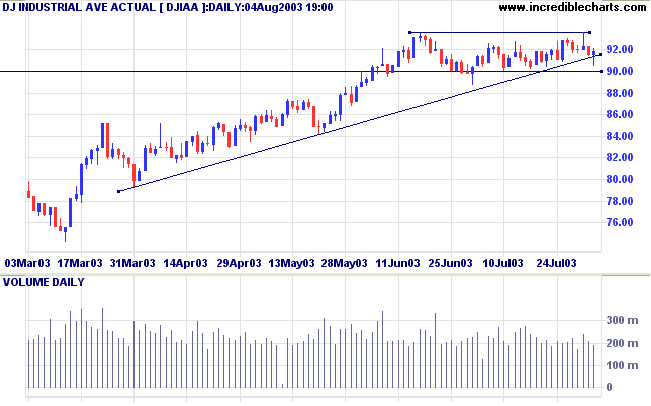
The Dow fell sharply at the opening but recovered to close
slightly up at 9186. Lower volume indicates that the reversal is
fairly weak.
The intermediate trend is up. The index has formed a bullish ascending triangle with resistance at 9360. Support is at 9000.
The primary trend is up.
The intermediate trend is up. The index has formed a bullish ascending triangle with resistance at 9360. Support is at 9000.
The primary trend is up.
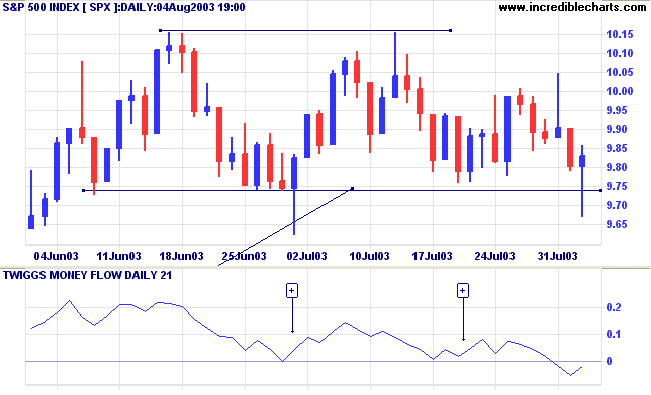
The S&P 500 made a false break below support, recovering to
close 3 points up at 983.
The intermediate trend is up. The index appears to be ranging between 1015 and 974. A fall below 974 will signal an intermediate down-trend.
Twiggs Money Flow (21) has crossed below zero, signaling distribution.
The primary trend is up.
The intermediate trend is up. The index appears to be ranging between 1015 and 974. A fall below 974 will signal an intermediate down-trend.
Twiggs Money Flow (21) has crossed below zero, signaling distribution.
The primary trend is up.
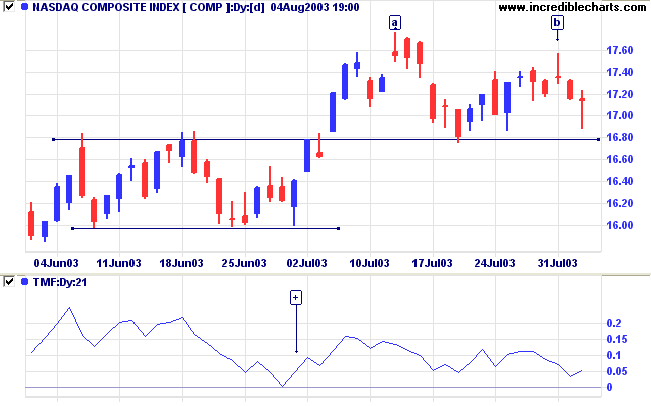
The Nasdaq Composite held above the 1679 support level, closing
down 2 points at 1714.
The intermediate trend is up. The index has formed a bearish lower high at [b]; a break below 1679 will signal a down-trend.
The primary trend is up.
The intermediate trend is up. The index has formed a bearish lower high at [b]; a break below 1679 will signal a down-trend.
The primary trend is up.
The Chartcraft NYSE Bullish % Indicator has
fallen back to 75.39% (August 1).
Market Strategy
Short-term: Long if the S&P500 is above 986. Short if below 974.
Intermediate: Long if S&P 500 is above 1015. Short if below 950.
Long-term: Long is the index is above 974.
Short-term: Long if the S&P500 is above 986. Short if below 974.
Intermediate: Long if S&P 500 is above 1015. Short if below 950.
Long-term: Long is the index is above 974.
August/September
August and September are, historically, the market's worst two months of the year. (more)
August and September are, historically, the market's worst two months of the year. (more)
Treasury yields
The yield on 10-year treasury notes eased a further 10 points to 4.32%.
The intermediate and primary trends are both up.
The yield on 10-year treasury notes eased a further 10 points to 4.32%.
The intermediate and primary trends are both up.
Gold
New York (18.42): Spot gold has leveled off at $349.30.
The primary trend is still upwards.
New York (18.42): Spot gold has leveled off at $349.30.
The primary trend is still upwards.
ASX Australia
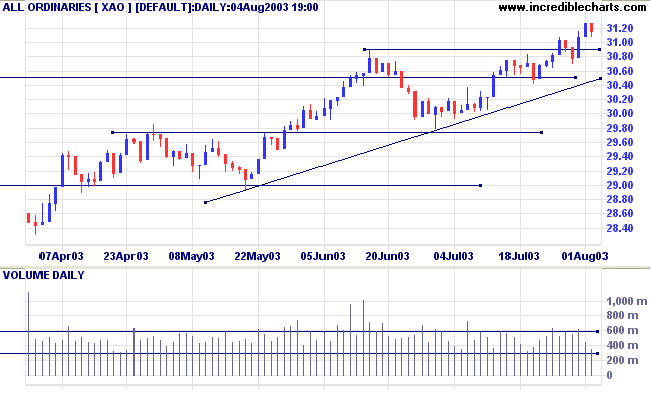
The All Ordinaries displays a healthy up-trend. Monday retraced
10 points to close at 3116 but on low volume.
The intermediate trend is up. A fall below 2978 would signal a reversal.
The primary trend is up.
Slow Stochastic (20,3,3) is above its signal line; MACD (26,12,9) is above; Twiggs Money Flow signals accumulation.
The intermediate trend is up. A fall below 2978 would signal a reversal.
The primary trend is up.
Slow Stochastic (20,3,3) is above its signal line; MACD (26,12,9) is above; Twiggs Money Flow signals accumulation.
Market Strategy
Short-term: Long if the All Ords is above 3127. Short if the index falls below 2978.
Intermediate: Long if the index is above 3127.
Long-term: Long if the index is above 2978 .
Short-term: Long if the All Ords is above 3127. Short if the index falls below 2978.
Intermediate: Long if the index is above 3127.
Long-term: Long if the index is above 2978 .
Centennial Coal [CEY]
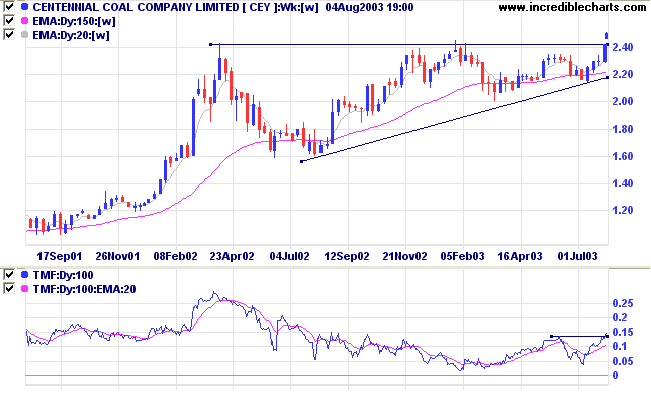
CEY has formed a long-term ascending triangle, completed with a breakout above resistance at 2.43.
Twiggs Money Flow (100) signals strong accumulation. MACD is bullish.
CEY has formed a long-term ascending triangle, completed with a breakout above resistance at 2.43.
Twiggs Money Flow (100) signals strong accumulation. MACD is bullish.
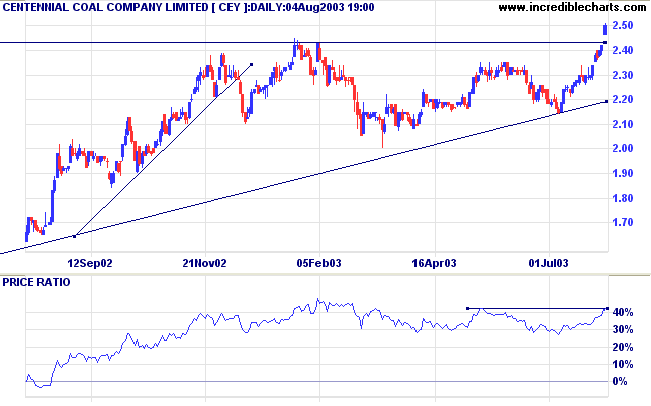
Relative Strength (price ratio: xao) has risen to a 3-month
high.
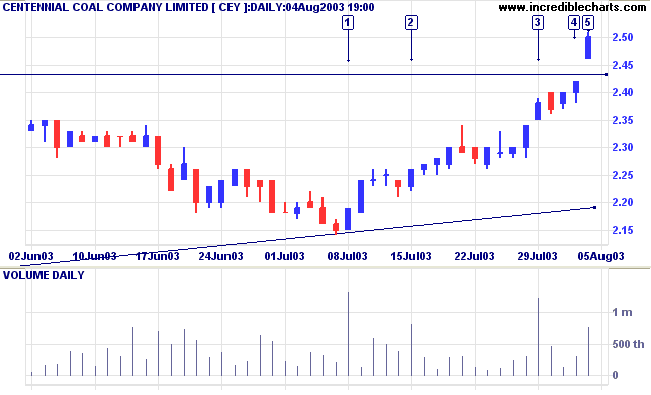
High volume is evident on up-days at [1], [2] and [3]. Volume
on the gap above resistance at [5] is reasonable but not
spectacular. Gaps often exhaust short-term momentum and there
may be a pull-back to test support at 2.42, the high of [4].
The target for the breakout is 3.20 (2.40 + 2.40 - 1.60). There
is no overhead resistance, an encouraging prospect.
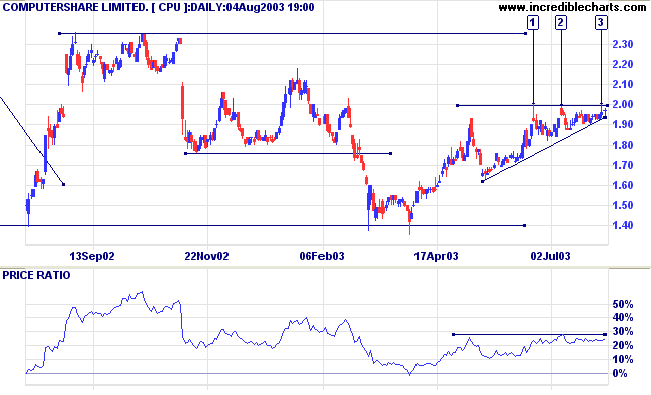
Computershare [CPU]
Last covered on June 16, 2003.
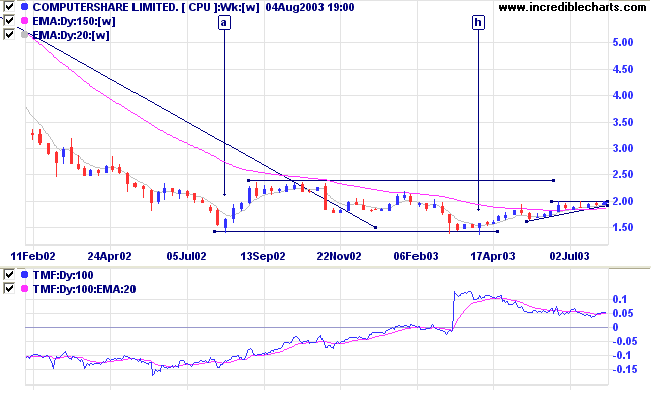
After forming a broad base, with a double bottom at [a] and [h], CPU has formed an ascending triangle over the last 2 months.
Twiggs Money Flow (100) is above zero but shows a bearish divergence, declining while price rises. MACD is bullish.
Last covered on June 16, 2003.
After forming a broad base, with a double bottom at [a] and [h], CPU has formed an ascending triangle over the last 2 months.
Twiggs Money Flow (100) is above zero but shows a bearish divergence, declining while price rises. MACD is bullish.
Relative Strength (price ratio: xao) has yet to make a new
3-month high.
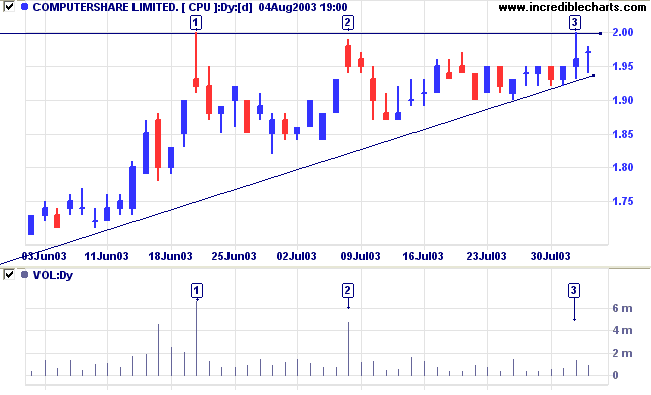
Weak closes at [1] and [2] on the daily volume chart,
accompanied by strong volume, signal heavy resistance at
2.00.
The close at [3] was still weak but lower volume signals that resistance may be diminishing.
The close at [3] was still weak but lower volume signals that resistance may be diminishing.
A breakout above 2.00 would be bullish but it may be advisable
to wait for a pull-back before entering. Confirmation appears
weak.
The target for a breakout would be the 2.35 resistance level.
The target for a breakout would be the 2.35 resistance level.
Understanding
the Trading Diary has been expanded to offer further
assistance to readers.
Colin Twiggs
Rules Conditional # 2
To "buy down" requires a long purse and a strong nerve,
and ruin often overtakes those who have both nerve and
money.
The stronger the nerve the more probability of staying too
long.
~ SA Nelson: The ABC of Stock Speculation (1903).
| Stock Screens: % Of High |
|
We have adjusted the stock screen
filter to compare closing price to the previous highest
closing price. Previously, closing price was compared
to the previous highest price. |
Back Issues
You can now view back issues at the Daily Trading Diary Archives.
You can now view back issues at the Daily Trading Diary Archives.
Back Issues
Access the Trading Diary Archives.