| Searching the Trading Diary Archives |
Use the normal Search function at the
top of the website page:
EXAMPLE |
Trading Diary
July 15, 2003
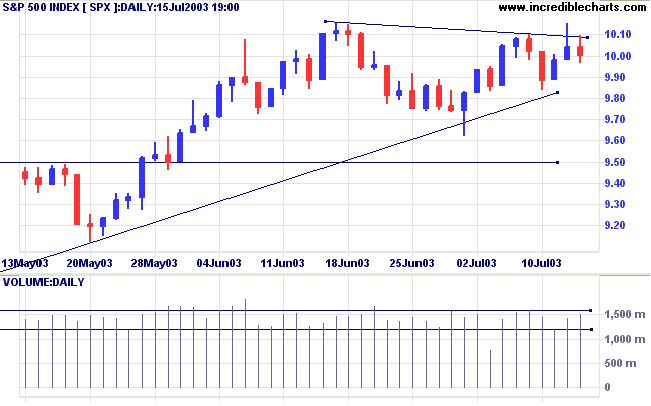
The Dow retreated 0.5% to 9128. Higher volume on the decline is a bearish sign, as are the two equal highs below the previous high.
The intermediate trend is up. A decline below 8978 will signal a down-turn.
The primary trend is up.
The intermediate trend is up. A fall below 962 will signal a down-turn.
The primary trend is up.
The intermediate trend is up. Positive results from Intel should boost the index on Wednesday.
The primary trend is up.
Intermediate: Long if the S&P is above 1015. Short if the index falls below 962.
Long-term: Long.
The chip-maker reported strong sales and earnings of 14 cents a share, compared to 7 cents a year ago.(more)
The Fed Chairman plays down the use of unconventional policy measures, such as purchasing long-term treasury bonds, sending bond yields to a 10-week high.(more)
New York (18.20): Spot gold has fallen to $US 342.10.
Gold is above the long-term upward trendline on the five year chart.
The intermediate trend is up.
The primary trend is up.
MACD (26,12,9) has crossed to above its signal line; Slow Stochastic (20,3,3) is above; Twiggs Money Flow (21) signals accumulation.
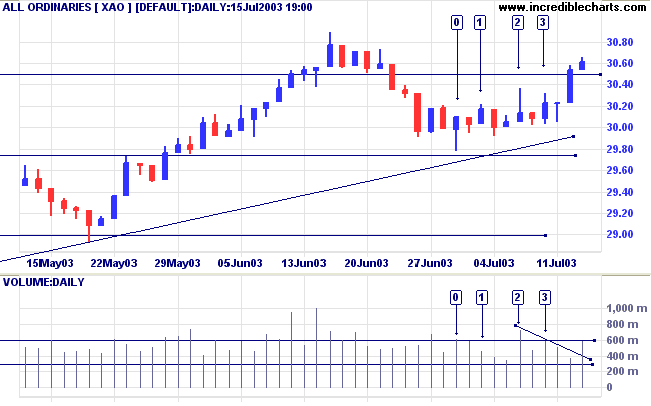
Intermediate: The primary trend is up; Long if the All Ords is above 3066.
Long-term: Long.
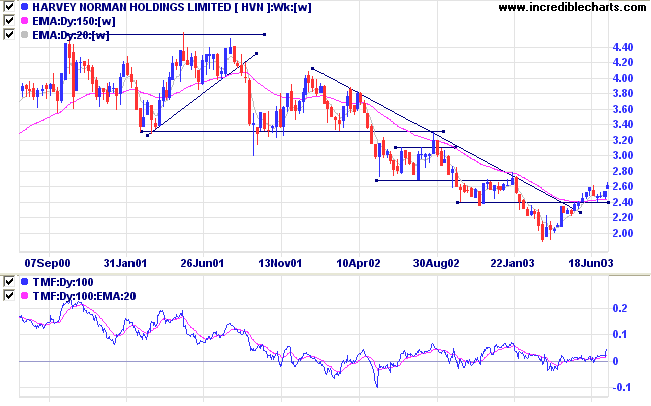
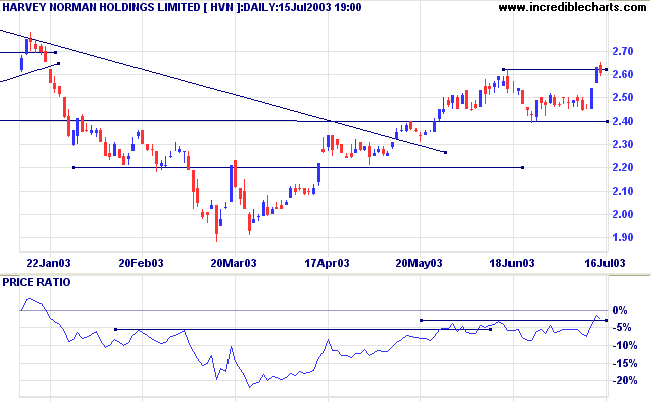
Last covered on June 19,2003.
The stock has completed an inverted head and shoulders reversal, with the second shoulder respecting the 2.40 support level before rallying to a new high.
Twiggs Money Flow (100-day) signals accumulation.
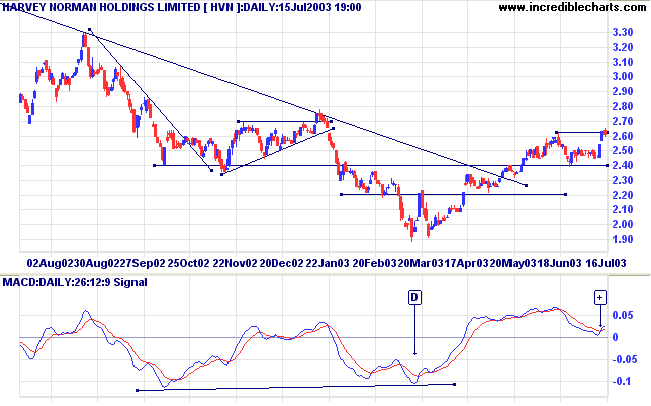
Strong selling pressure is evident on the corrections at the end of May and mid-June [1].
The subsequent pull-back was fairly short (5 days) but on heavy volume. The false break below support at [2] is a bullish sign: strong volume and a weak close above the support level.
Rallies to [4] were short but we then witness a dry-up of volume on the correction and narrow ranges at [5] and [6]. These present entry opportunities: place a buy-stop above the high and a stop-loss below 2.40 (less than 5% from the entry point).
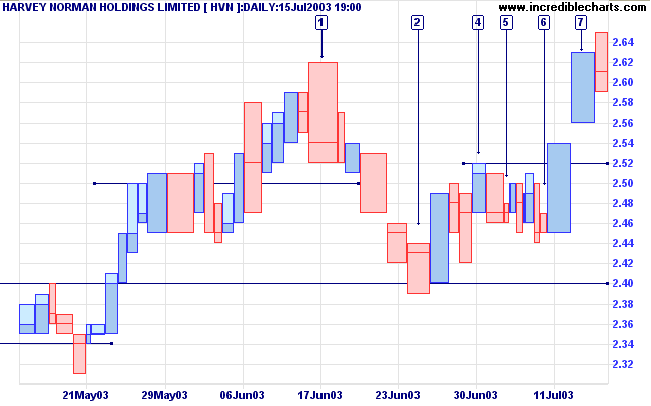
Further bullish signs would be a dry-up of volume and volatility on the correction.
A fall below 2.40 would be bearish.
who do not recognize their opportunities.
~ Wall Street maxim
S.A. Nelson: The ABC of Stock Speculation (1902).
| Stock Screens: MACD |
|
An MACD trough that respects the
zero line is a strong bull signal. To highlight
MACD troughs above zero: |
You can now view back issues at the Daily Trading Diary Archives.
Back Issues