ETOs and Warrants
Introduction of ASX ETOs and warrants is taking longer than anticipated
but we expect to have them ready shortly.
Introduction of ASX ETOs and warrants is taking longer than anticipated
but we expect to have them ready shortly.
Trading Diary
July 2, 2003
These extracts from my daily trading diary are
intended to illustrate the techniques used in short-term trading
and should not be interpreted as investment advice. Full terms
and conditions can be found at Terms
of Use .
USA
The Dow rallied strongly, closing up 1.1% at 9142 on higher volume.
The intermediate trend is still down. Tuesday's false break, below support at 8900, is a bullish sign.
The primary trend is up.
The Dow rallied strongly, closing up 1.1% at 9142 on higher volume.
The intermediate trend is still down. Tuesday's false break, below support at 8900, is a bullish sign.
The primary trend is up.
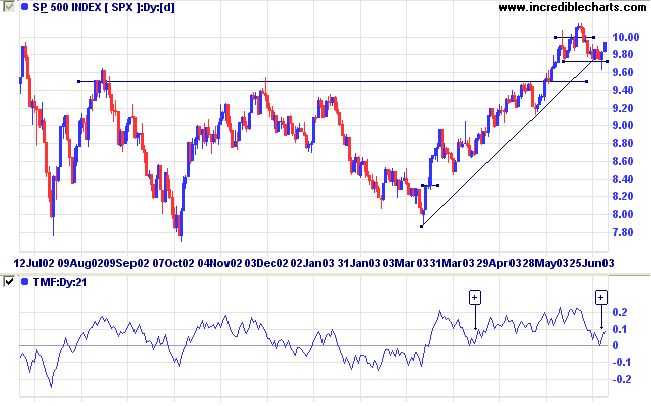
The S&P 500 rallied 11 points to close at 993.
The intermediate trend has turned up. Tuesday's false break below 972 is a bullish sign.
The primary trend is up.
The intermediate trend has turned up. Tuesday's false break below 972 is a bullish sign.
The primary trend is up.
The Nasdaq Composite gapped up at the opening before rallying to
close 2.3% higher at 1678.
The intermediate trend is up. A rise above 1686 will complete a bullish double bottom pattern.
The primary trend is up.
The intermediate trend is up. A rise above 1686 will complete a bullish double bottom pattern.
The primary trend is up.
The Chartcraft NYSE Bullish % Indicator retreated
to 74.24% on July 1; 0.98% from its peak.
Market Strategy
Short-term: Long if the S&P 500 is above 989 (Friday's
high).
Intermediate: Long if the S&P is above 989.
Long-term: Long.
Intermediate: Long if the S&P is above 989.
Long-term: Long.
Short week
US markets will close 1.00 p.m. Thursday ahead of Friday, Fourth of July holiday.
US markets will close 1.00 p.m. Thursday ahead of Friday, Fourth of July holiday.
Gold
New York (17.57): Spot gold rose to $US 351.20.
On the five-year chart gold is above the long-term upward trendline.
New York (17.57): Spot gold rose to $US 351.20.
On the five-year chart gold is above the long-term upward trendline.
ASX Australia
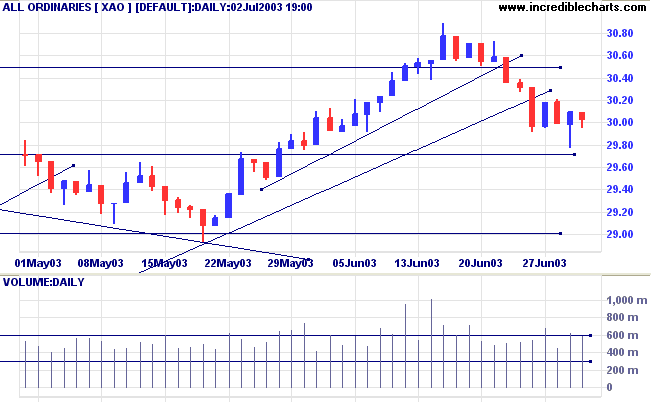
The All Ordinaries formed an inside day, signaling uncertainty.
The index closed down 6 points at 3003 on strong volume. The
positive performance of US markets should help to lift the local
market.
The intermediate trend is still down.
The primary trend is up.
The intermediate trend is still down.
The primary trend is up.
Market Strategy
Short-term: Long if the All Ords is above 3021 (Monday's
high).
Intermediate: The primary trend has reversed up; Long if the All Ords is above 3021.
Long-term: Long.
Intermediate: The primary trend has reversed up; Long if the All Ords is above 3021.
Long-term: Long.
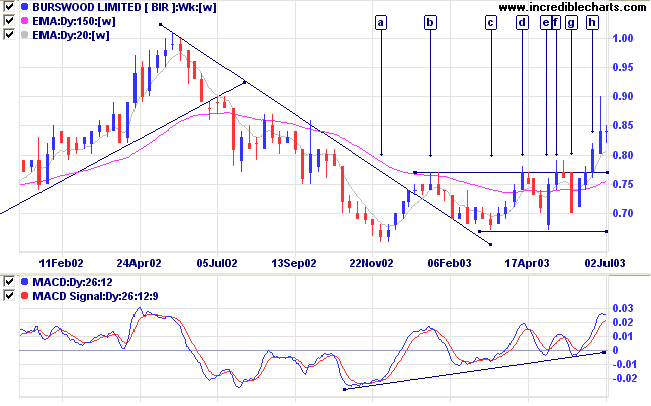
Burswood [BIR]
BIR broke out of a stage 1 base at [h] after failed attempts at [d] and [f].
The V-bottom at [a] re-tested support at [c], becoming a double bottom, and again at [e] to form a triple bottom,
before a higher trough at [g] signaled the likelihood of a breakout.
MACD is trending upwards, a bullish sign.
Relative Strength (price ratio: xao) has reached a new 3-month
high, another bull signal. Twiggs Money Flow signals
accumulation.
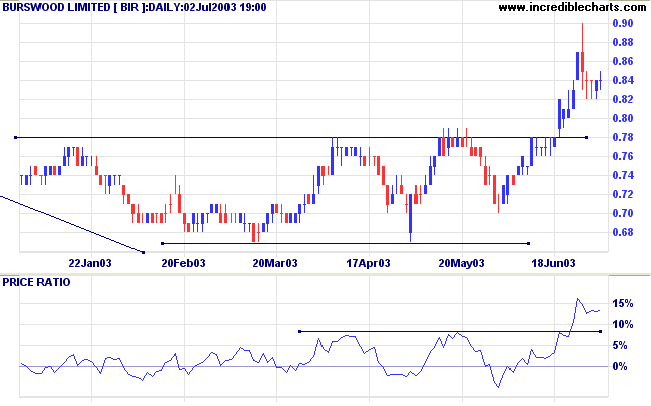
The equivolume chart shows heavy selling into the rally at [1],
with buying support evident between 0.82 and 0.84 at [2].
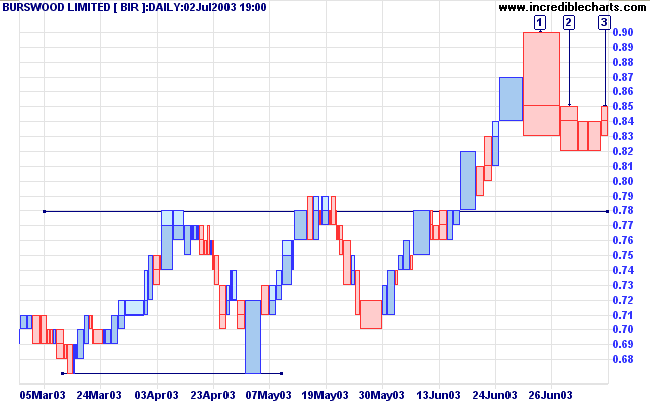
A re-test of support at 0.78 may present entry opportunities.
Watch for a dry-up of volume and daily range (volatility) close
to the support line.
Failure of the 0.78 support level would be bearish.
A straight rally above 0.85 may be prone to failure unless accompanied by heavy volume.
Failure of the 0.78 support level would be bearish.
A straight rally above 0.85 may be prone to failure unless accompanied by heavy volume.
Understanding
the Trading Diary has been expanded to offer further
assistance to readers.
Colin Twiggs
In theory one is aware that the earth revolves, but in practice
one does not perceive it,
the ground upon which one treads seems not to move, and one can live undisturbed.
So it is with Time in one's life.
~ Marcel Proust, The Past Recaptured (1927).
the ground upon which one treads seems not to move, and one can live undisturbed.
So it is with Time in one's life.
~ Marcel Proust, The Past Recaptured (1927).
Stock Screens: Sector
When conducting a stock screen
you can select all equities, sector indexes only,
or all equities in a specific sector or industry group.
When conducting a stock screen
you can select all equities, sector indexes only,
or all equities in a specific sector or industry group.
Back Issues
Access the Trading Diary Archives.