Become a Premium member for
only $180 (AUD).
Subscribe by 31 May 2003.
The Daily Trading Diary will only be available to Premium members.
We have extended the cut-off until mid-May - to fit in with the introduction of US charts.
Subscribe by 31 May 2003.
The Daily Trading Diary will only be available to Premium members.
We have extended the cut-off until mid-May - to fit in with the introduction of US charts.
Trading Diary
May 16, 2003
These extracts from my daily trading diary are
intended to illustrate the techniques used in short-term trading
and should not be interpreted as investment advice. Full terms
and conditions can be found at Terms
of Use .
USA
The Dow formed an inside day, closing down 0.4%
at 8678 on higher volume; continuing the small
pennant pattern.
The intermediate trend is up.
The primary trend is down; a rise above 9076 will signal a reversal.
The intermediate trend is up.
The primary trend is down; a rise above 9076 will signal a reversal.
The S&P 500 closed 2 points lower at 944,
consolidating below resistance at 950.
The intermediate up-trend continues.
The primary trend is down; a rise above 954 will signal an up-trend.
The intermediate up-trend continues.
The primary trend is down; a rise above 954 will signal an up-trend.
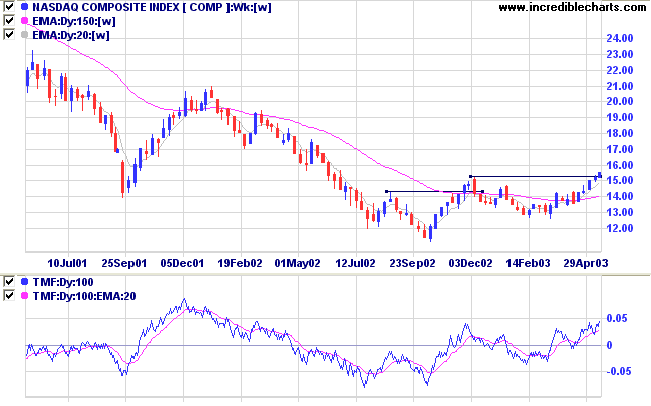
The Nasdaq Composite eased 0.8%, closing at
1538.
The intermediate trend is up.
The index is in a primary up-trend.
The Chartcraft NYSE Bullish % Indicator increased to 60.51% on May 15, following a Bull Correction buy signal on April 3.
The intermediate trend is up.
The index is in a primary up-trend.
The Chartcraft NYSE Bullish % Indicator increased to 60.51% on May 15, following a Bull Correction buy signal on April 3.
Market Strategy
Short-term: Long if the S&P 500 is above
948; short if the S&P intermediate trend reverses down (or
falls below 898).
Intermediate: Long if the Dow/S&P primary
trend turns upwards; short if the intermediate trend (S&P)
reverses down.
Long-term: There are already two bull signals: the March 17 follow through day and the April 3 NYSE Bullish % signal. Wait for confirmation from a Dow/S&P primary trend reversal.
Long-term: There are already two bull signals: the March 17 follow through day and the April 3 NYSE Bullish % signal. Wait for confirmation from a Dow/S&P primary trend reversal.
Gold
New York (15.30): Spot gold finished strongly, closing at $US 354.20.
On the five-year chart gold has respected the long-term upward trendline.
New York (15.30): Spot gold finished strongly, closing at $US 354.20.
On the five-year chart gold has respected the long-term upward trendline.
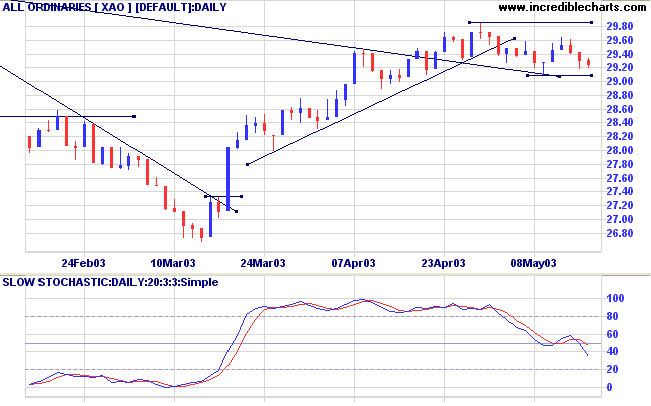
ASX Australia
The All Ordinaries lost a further 7 points to close at 2924.
Lighter volume signals that the index may still hold above the
2909 support level.
The intermediate trend is up; a close below 2909 will signal a reversal.
The primary trend is down. A rise above 3062 will signal an up-trend.
MACD (26,12,9) is below its signal line; Slow Stochastic (20,3,3) has crossed back below; Twiggs Money Flow (21) is weakening.
The intermediate trend is up; a close below 2909 will signal a reversal.
The primary trend is down. A rise above 3062 will signal an up-trend.
MACD (26,12,9) is below its signal line; Slow Stochastic (20,3,3) has crossed back below; Twiggs Money Flow (21) is weakening.
Market Strategy
Short-term: Long if the All Ords rises above 2934; short if the
XAO falls below 2909.
Intermediate: Long if the primary trend reverses up (XAO above 3062); short if the intermediate trend reverses down (falls below 2909).
Long-term: There is already a bull signal: the March 18 follow through. Wait for confirmation from a primary trend reversal.
Intermediate: Long if the primary trend reverses up (XAO above 3062); short if the intermediate trend reverses down (falls below 2909).
Long-term: There is already a bull signal: the March 18 follow through. Wait for confirmation from a primary trend reversal.
Sector Analysis
Changes are highlighted in bold.
Changes are highlighted in bold.
- Energy [XEJ] - stage 1 (RS is level)
- Materials [XMJ] - stage 3 (RS is falling)
- Industrials [XNJ] - stage 4 (RS is falling)
- Consumer Discretionary [XDJ] - stage 1 (RS is level)
- Consumer Staples [XSJ] - stage 1 (RS is rising)
- Health Care [XHJ] - stage 4 (RS is level)
- Property Trusts [XPJ] - stage 3 (RS is rising)
- Financial excl. Property Trusts [XXJ] - stage 1 (RS is rising)
- Information Technology [XIJ] - stage 4 (RS is falling)
- Telecom Services [XTJ] - stage 4 (RS is falling)
- Utilities [XUJ] - stage 2 (RS is rising)
Sectors: Relative Strength
A stock screen of the ASX 200 using % Price Move (1 month: +5%) held at 65 stocks (compared to 131 on April 11, 2003; and 8 on March 14, 2003).
A stock screen of the ASX 200 using % Price Move (1 month: +5%) held at 65 stocks (compared to 131 on April 11, 2003; and 8 on March 14, 2003).
- Diversified Financial (4)
- Banks (4)
- Gold (4)
- Health Care Facilities (3)
- Data Processing (3)
- Broadcasting and Cable TV (3)
New! Understanding
the Trading Diary has been expanded to offer further
assistance to readers.
Colin Twiggs
The hardest lessons to learn are those that
are the most obvious.
- Theodore Roosevelt.
Back Issues
Click here to access the Trading Diary Archives.
Click here to access the Trading Diary Archives.
Back Issues
Access the Trading Diary Archives.